The AAPG/Datapages Combined Publications Database
AAPG Bulletin
Figure
AAPG Bulletin; Year: 2025; Issue: April DOI: 10.1306/02262523078
Return to Full Text
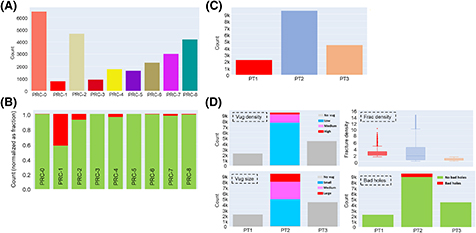
Figure 16. Case study 4: West Africa Pre-Salt Aptian. (A) Bar diagram showing proportions of nine, mutually exclusive, electrofacies, now labelled petrophysical rock categories (PRC). (B) Bar diagram showing “bad hole” attribute following analysis of borehole imagery, lost circulation, and excessive caliper observations. (C, D) Simple bar diagrams displaying three dominant pore types (PT) which represent both conductive fracture (Frac) density, pore size and density, and bad holes that can be predicted by logs. Novug = no vugs.
Figure 16. Case study 4: West Africa Pre-Salt Aptian. (A) Bar diagram showing proportions of nine, mutually exclusive, electrofacies, now labelled petrophysical rock categories (PRC). (B) Bar diagram showing “bad hole” attribute following analysis of borehole imagery, lost circulation, and excessive caliper observations. (C, D) Simple bar diagrams displaying three dominant pore types (PT) which represent both conductive fracture (Frac) density, pore size and density, and bad holes that can be predicted by logs. Novug = no vugs.