The AAPG/Datapages Combined Publications Database
AAPG Bulletin
Figure
AAPG Bulletin; Year: 2025; Issue: April DOI: 10.1306/02262523078
Return to Full Text
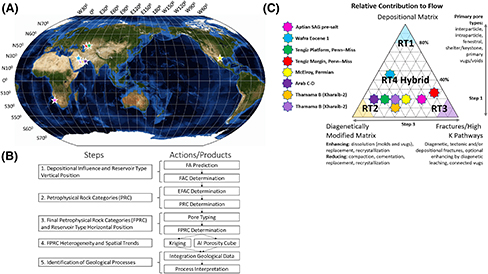
Figure 3. (A) Equal Earth projection showing the locations of the four case studies and four reservoirs from the public domain (using as template https://www.giss.nasa.gov/tools/gprojector/help/projections/). (B) Flow diagram explaining the preanalysis data scenario and subsequent five-step advanced rock typing road map. (C) The ternary diagram (modified from Skalinski and Kenter, 2014, Figure 3A) reports the relative contribution to flow of three main drivers and shows the reservoir types of four published reservoirs (Saneifar et al., 2015; Skalinski and Kenter, 2015) and the four case studies in this paper. Note that symbols and colors from (A) are used for display in (B) as well. AI = acoustic impedance; EFAC = electrofacies association category; FA = facies association; FAC = facies association category; Penn–Miss = Pennsylvanian–Mississippian; RT = reservoir type; SAG = sag-type basin formation during period of thermal subsidence.
Figure 3. (A) Equal Earth projection showing the locations of the four case studies and four reservoirs from the public domain (using as template https://www.giss.nasa.gov/tools/gprojector/help/projections/). (B) Flow diagram explaining the preanalysis data scenario and subsequent five-step advanced rock typing road map. (C) The ternary diagram (modified from Skalinski and Kenter, 2014, Figure 3A) reports the relative contribution to flow of three main drivers and shows the reservoir types of four published reservoirs (Saneifar et al., 2015; Skalinski and Kenter, 2015) and the four case studies in this paper. Note that symbols and colors from (A) are used for display in (B) as well. AI = acoustic impedance; EFAC = electrofacies association category; FA = facies association; FAC = facies association category; Penn–Miss = Pennsylvanian–Mississippian; RT = reservoir type; SAG = sag-type basin formation during period of thermal subsidence.