The AAPG/Datapages Combined Publications Database
AAPG Bulletin
Figure
AAPG Bulletin; Year: 2025; Issue: April DOI: 10.1306/02262523078
Return to Full Text
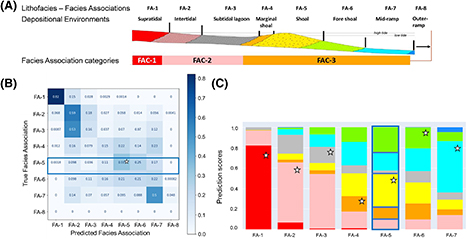
Figure 4. Case study: Middle East Arab C-D. (A) Depositional profile showing facies associations (FA)-1 to FA-8, which are lumped into predictable FA categories (FAC)-1 to FAC-4 resulting from the subsequent steps of the workflow; note that FA-8 and consequently FAC-4 are encountered in the log domain only. (B, C) Prediction results for FAs visualized by contingency table (B) and by stacked bars (C). Note that the blue box in (B) with the scores corresponds to that in (C). The white stars show the prediction of each FA into its own class. The mean prediction score is calculated as 35%.
Figure 4. Case study: Middle East Arab C-D. (A) Depositional profile showing facies associations (FA)-1 to FA-8, which are lumped into predictable FA categories (FAC)-1 to FAC-4 resulting from the subsequent steps of the workflow; note that FA-8 and consequently FAC-4 are encountered in the log domain only. (B, C) Prediction results for FAs visualized by contingency table (B) and by stacked bars (C). Note that the blue box in (B) with the scores corresponds to that in (C). The white stars show the prediction of each FA into its own class. The mean prediction score is calculated as 35%.