The AAPG/Datapages Combined Publications Database
AAPG Bulletin
Figure
AAPG Bulletin; Year: 2025; Issue: April DOI: 10.1306/03182523084
Return to Full Text
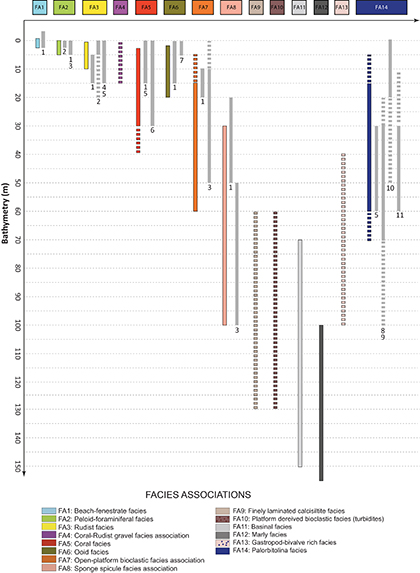
Figure 6. Graphical representation of the bathymetric range attributed to each facies associations and comparison with data from literature. Sources for bathymetry estimates: (1) Bastide (2014); (2) Masse et al. (2003); (3) Hillgärtner et al. (2003); (4) Burla et al. (2008); (5) Immenhauser et al. (2004); (6) Bover-Arnal et al. (2012); (7) Purdy (1961); (8) Masse (1976); (9) Rey and Cugny (1977); (10) Arnaud et al. (1998); (11) Hughes (2000).
Figure 6. Graphical representation of the bathymetric range attributed to each facies associations and comparison with data from literature. Sources for bathymetry estimates: (1) Bastide (2014); (2) Masse et al. (2003); (3) Hillgärtner et al. (2003); (4) Burla et al. (2008); (5) Immenhauser et al. (2004); (6) Bover-Arnal et al. (2012); (7) Purdy (1961); (8) Masse (1976); (9) Rey and Cugny (1977); (10) Arnaud et al. (1998); (11) Hughes (2000).