The AAPG/Datapages Combined Publications Database
AAPG Bulletin
Figure
AAPG Bulletin; Year: 2025; Issue: May DOI: 10.1306/04042524030
Return to Full Text
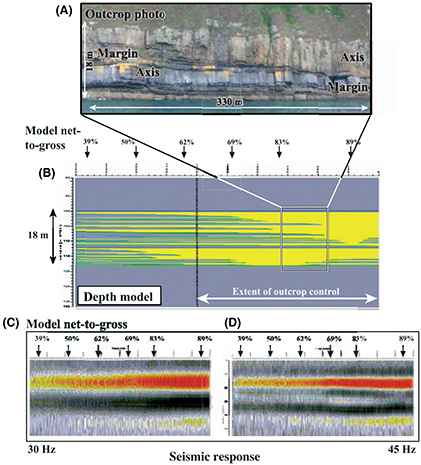
Figure 9. Forward seismic model of an outcrop from the Ross Formation (Ireland) demonstrating the decrease in amplitude as net-to-gross (NTG) decreases from axis to margin (from Sullivan et al., 2004). (A) Photo of the outcrop showing both marginal and axial deposition. (B) Synthetic model of NTG variability. (C) The 30-Hz Ricker synthetic seismic and (D) the 45-Hz synthetic seismic model of outcrop.
Figure 9. Forward seismic model of an outcrop from the Ross Formation (Ireland) demonstrating the decrease in amplitude as net-to-gross (NTG) decreases from axis to margin (from Sullivan et al., 2004). (A) Photo of the outcrop showing both marginal and axial deposition. (B) Synthetic model of NTG variability. (C) The 30-Hz Ricker synthetic seismic and (D) the 45-Hz synthetic seismic model of outcrop.