The AAPG/Datapages Combined Publications Database
Environmental Geosciences (DEG)
Figure
Environmental Geosciences (DEG); Year: 2017; Issue: December DOI: 10.1306/eg.07071717001
Return to Full Text

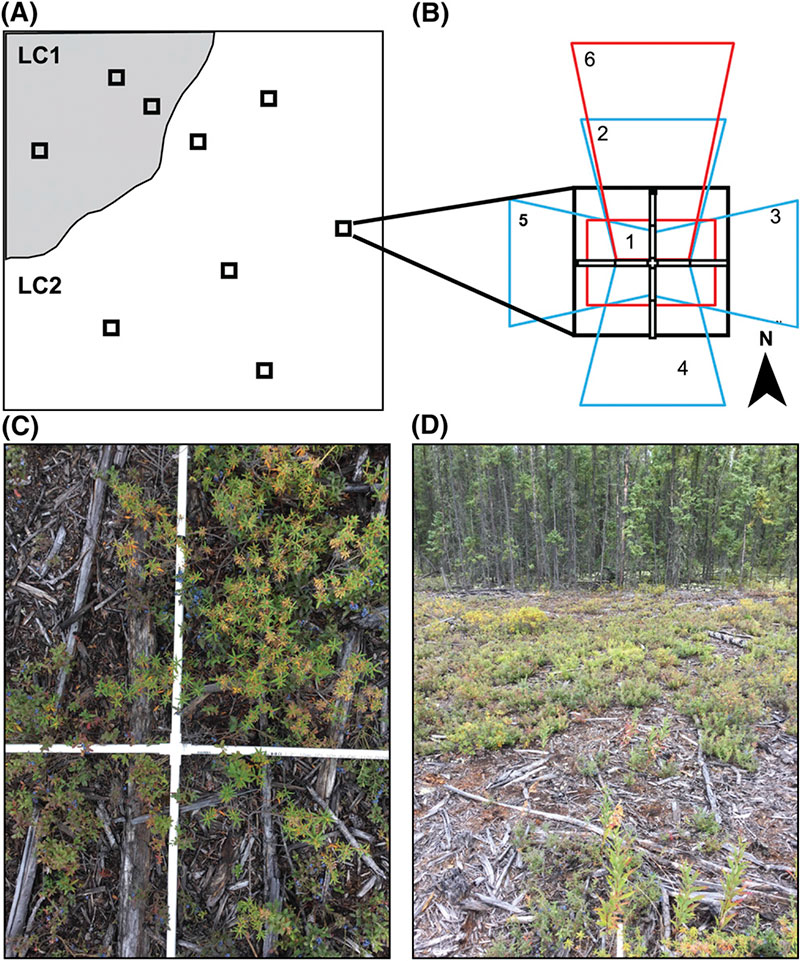
Figure 3. Illustration of field-sampling methods. (A) A hypothetical oil-sands-exploration (OSE) well pad with two distinct land covers, LC1 and LC2, occupying ∼30% and ∼70% of the total area, respectively. In this example, 10 sampling locations were placed. Sampling locations were proportionately divided among land covers and then randomly placed within each land cover. At each sampling location, a 2-m (7-ft) quadrat was placed (B). In addition to categorical data, six images were collected looking straight down at the center point (1), slightly up to the north (2), east (3), south (4), west (5), and a heads-up view to the north (6). (C) An example of a downward-looking image. (D) An example of a heads-up image. Note that these particular images capture “incipient scrub/shrub” in the field.

Figure 3. Illustration of field-sampling methods. (A) A hypothetical oil-sands-exploration (OSE) well pad with two distinct land covers, LC1 and LC2, occupying ∼30% and ∼70% of the total area, respectively. In this example, 10 sampling locations were placed. Sampling locations were proportionately divided among land covers and then randomly placed within each land cover. At each sampling location, a 2-m (7-ft) quadrat was placed (B). In addition to categorical data, six images were collected looking straight down at the center point (1), slightly up to the north (2), east (3), south (4), west (5), and a heads-up view to the north (6). (C) An example of a downward-looking image. (D) An example of a heads-up image. Note that these particular images capture “incipient scrub/shrub” in the field.