The AAPG/Datapages Combined Publications Database
Environmental Geosciences (DEG)
Figure
Environmental Geosciences (DEG); Year: 2019; Issue: September DOI: 10.1306/eg.02271918009
Return to Full Text
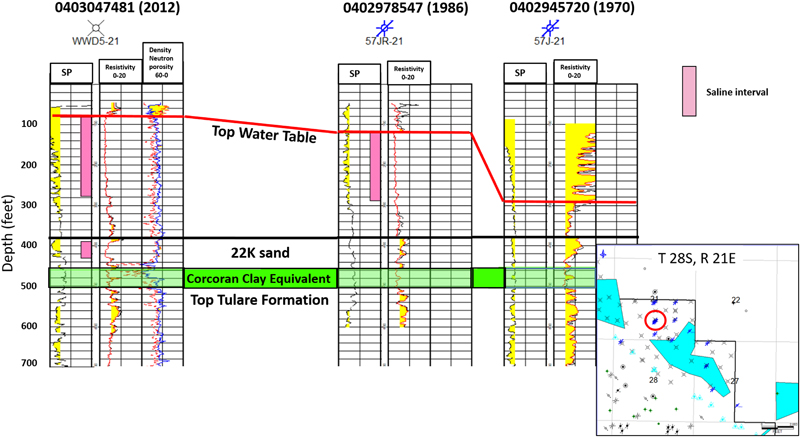
Figure 10. Cross section showing three wells drilled and logged in different years near a produced water disposal pond (light blue polygon on inset map). Yellow shading on spontaneous potential (SP) curve (left track) indicate sand layers. Yellow shading on resistivity curve (right track at scale of 0–20 ohm m) indicate resistivity of more than 3 ohm m. Pink bars indicate low resistivity sands affected by infiltration of saline produced water from the pond. The API numbers at the top of the logs are used for well identification. Year drilled and logged in parentheses. Depth scale in feet.
Figure 10. Cross section showing three wells drilled and logged in different years near a produced water disposal pond (light blue polygon on inset map). Yellow shading on spontaneous potential (SP) curve (left track) indicate sand layers. Yellow shading on resistivity curve (right track at scale of 0–20 ohm m) indicate resistivity of more than 3 ohm m. Pink bars indicate low resistivity sands affected by infiltration of saline produced water from the pond. The API numbers at the top of the logs are used for well identification. Year drilled and logged in parentheses. Depth scale in feet.