The AAPG/Datapages Combined Publications Database
Environmental Geosciences (DEG)
Figure
Environmental Geosciences (DEG); Year: 2019; Issue: September DOI: 10.1306/eg.02271918009
Return to Full Text
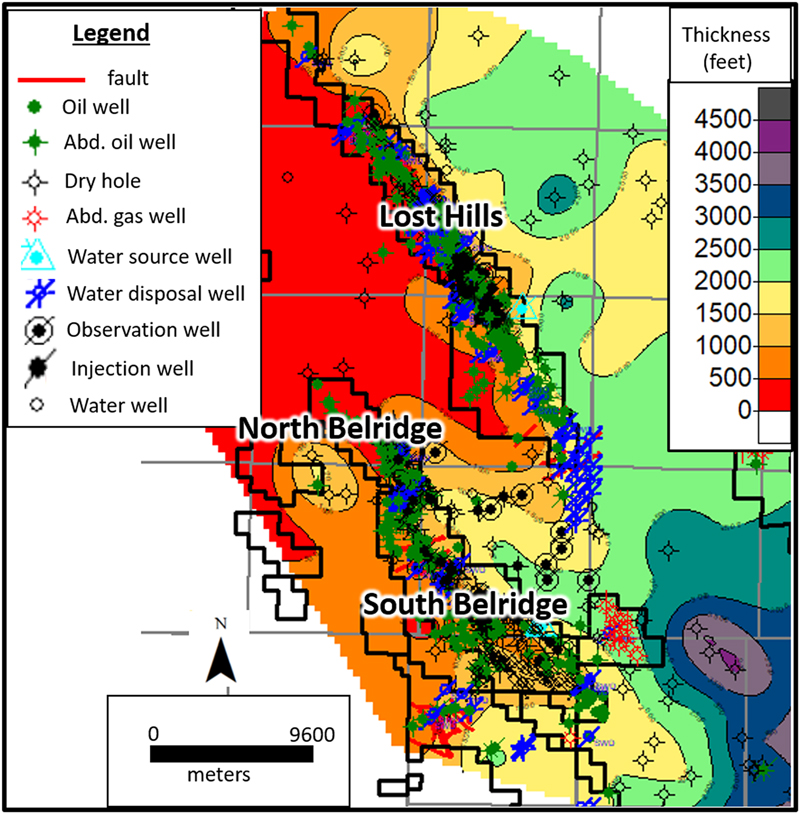
Figure 4. Map showing depth to base of Tulare Formation. The values are equivalent to the thickness of the Tulare Formation and overlying alluvium. Wells shown are those used to determine thickness. Black lines are oil field administrative boundaries. Gray lines are township boundaries. Red lines are faults (Young, 1968; California Division of Oil Gas and Geothermal Resources, 1998). Abd. = abandoned.
Figure 4. Map showing depth to base of Tulare Formation. The values are equivalent to the thickness of the Tulare Formation and overlying alluvium. Wells shown are those used to determine thickness. Black lines are oil field administrative boundaries. Gray lines are township boundaries. Red lines are faults (Young, 1968; California Division of Oil Gas and Geothermal Resources, 1998). Abd. = abandoned.