The AAPG/Datapages Combined Publications Database
Environmental Geosciences (DEG)
Figure
Environmental Geosciences (DEG); Year: 2019; Issue: September DOI: 10.1306/eg.02271918009
Return to Full Text
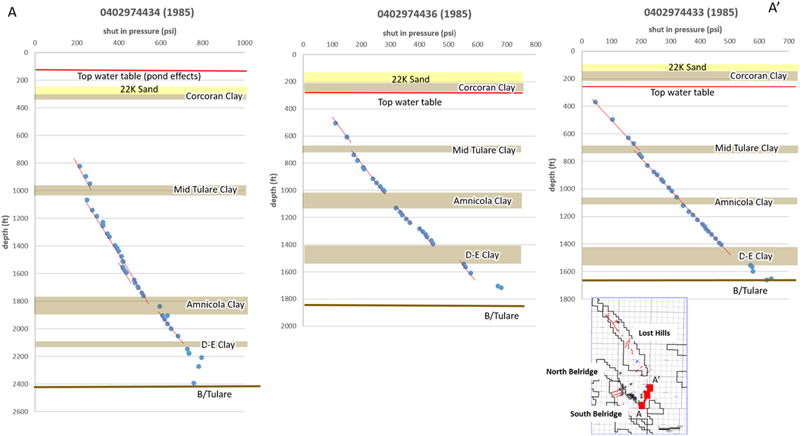
Figure 6. Graphs of shut-in pressure (from open-hole sequential formation testers) versus depth for three wells across the study area. Red lines are used to emphasize the pressure gradient. Tan areas show major clay layers, the 22K sand is shown in yellow. Base of Tulare and top of the water table are also noted. Wells are identified by their API number and the year drilled and logged at the top of each graph.
Figure 6. Graphs of shut-in pressure (from open-hole sequential formation testers) versus depth for three wells across the study area. Red lines are used to emphasize the pressure gradient. Tan areas show major clay layers, the 22K sand is shown in yellow. Base of Tulare and top of the water table are also noted. Wells are identified by their API number and the year drilled and logged at the top of each graph.