The AAPG/Datapages Combined Publications Database
Environmental Geosciences (DEG)
Figure
Environmental Geosciences (DEG); Year: 2020; Issue: March DOI: 10.1306/eg.09261919016
Return to Full Text
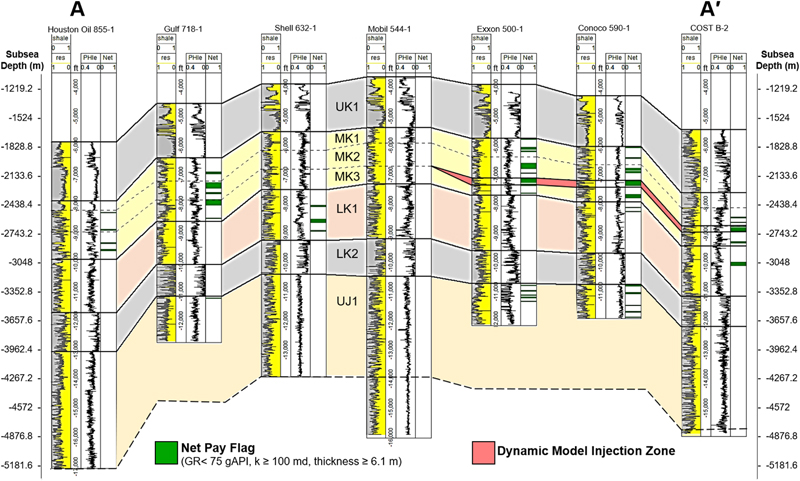
Figure 9. Structural cross section (see Figure 8 for areal transect) across the Great Stone Dome showing net pay flags calculated over the three storage zones and the selected injection zone for the dynamic reservoir simulation at the top of the middle Cretaceous. COST B-2 = Continental Offshore Stratigraphic Text well B-2; gAPI = API gamma-ray units; GR = gamma ray; k = permeability; LK1 = Lower Cretaceous 1; LK2 = Lower Cretaceous 2; MK1 = middle Cretaceous 1; MK2 = middle Cretaceous 2; MK3 = middle Cretaceous 3; PHIe = effective porosity; res = resistivity; UJ1 = Upper Jurassic 1; UK1 = Upper Cretaceous 1.
Figure 9. Structural cross section (see Figure 8 for areal transect) across the Great Stone Dome showing net pay flags calculated over the three storage zones and the selected injection zone for the dynamic reservoir simulation at the top of the middle Cretaceous. COST B-2 = Continental Offshore Stratigraphic Text well B-2; gAPI = API gamma-ray units; GR = gamma ray; k = permeability; LK1 = Lower Cretaceous 1; LK2 = Lower Cretaceous 2; MK1 = middle Cretaceous 1; MK2 = middle Cretaceous 2; MK3 = middle Cretaceous 3; PHIe = effective porosity; res = resistivity; UJ1 = Upper Jurassic 1; UK1 = Upper Cretaceous 1.