About This Item
- Full TextFull Text(subscription required)
- Pay-Per-View PurchasePay-Per-View
Purchase Options Explain
Share This Item
The AAPG/Datapages Combined Publications Database
GCAGS Transactions
Abstract
Aquifer Mineralogy and Natural Radionuclides in Groundwater - The Lower Paleozoic of Central Texas
Yongje Kim (1), Thomas T. Tieh (1), Ernest B. Ledger (2)
ABSTRACT
Water-mineral interactions in an aquifer may give rise to high levels of Ra and Rn in groundwater. An understanding of aquifer mineralogy is therefore essential to determine the sources of natural radionuclides and design possible means for improving water quality. Anomalous Ra and Rn concentrations have been detected in groundwater produced from the Cambrian Hickory and Cap Mountain aquifers in the Llano Uplift area of central Texas. This study examines cored aquifer rock samples, focusing on the abundance, distribution, and nature of occurrence of minerals containing U and Th, parent nuclides of Ra and Rn.
The Hickory, 136 m thick, consists of a coarse grained lower, a calcareous middle, and a fossiliferous and hematitic upper unit, with thin shale laminae throughout. The Cap Mountain, 44 m thick, is a sandy limestone. Detrital materials are composed of 77 % quartz, 19 % feldspars, and 4 % lithic fragments. Accessory minerals average less than 1 %. Authigenic minerals, primarily carbonate, clay, and Fe-oxide minerals, make up 18 % of the bulk rock. Porosity is of secondary origin.
Analysis of U in 123 samples by delayed-neutron counting shows an average concentration of 3.8 ppm. Shaly samples generally contain significantly higher U. Gamma-ray analysis of Th in 21 samples yields an average of 13.7 ppm. Fission-track imaging shows that U occurs predominantly in: (1) phosphatic fossil fragments and intraclasts, especially in the Cap Mountain; (2) thin shaly laminae which are more abundant in the Hickory; (3) authigenic minerals including hematite and clay minerals, also common in the Hickory; and (4) detrital accessory minerals.
Mobilization of U and its decay products by groundwater can account for the Ra and Rn in the produced water, particularly from intervals where there are high concentrations of shaly laminae, phosphatic materials, or hematitic cement.
INTRODUCTION
Water-mineral interactions in an aquifer may produce significant natural radionuclide levels in groundwater that can constitute a long term health hazard. Two short-lived polonium daughters, Po-218 and Po-214, produced from radon-222 decay can cause severe damage to the lung and possibly lung cancer by alpha radiation when natural radium (Ra) or radon (Rn) is ingested (Cross et al., 1985; Cross, 1987; Gundersen et al., 1992). This study is to determine the sources and geologic factors affecting Ra and Rn in groundwaters produced from Paleozoic aquifers northwest of the Llano Uplift area in central Texas (Fig. 1). The Cambrian Hickory sandstone and Cap Mountain sandy limestone, which supply most of the groundwater in the region, are known to have high radioactivity (Cech et al., 1987a, 1987b, 1988). An understanding of aquifer mineralogy, particularly the abundance, distribution, and nature of occurrence of minerals containing uranium (U) and thorium (Th), parent radionuclides of Ra and Rn, is necessary in order to pinpoint the sources of radionuclides in the water.
The primary objectives of this study are to: (1) determine the mineralogical composition and texture of rocks comprising the aquifer; (2) determine the abundance of U and Th and the distribution and nature of occurrence of U-bearing minerals in these rocks; and (3) assess the relation between aquifer mineralogy and groundwater Ra and Rn anomaly.
GEOLOGIC BACKGROUND
The Llano area in central Texas is a broad structural dome which has been weathered and eroded to expose approximately 9,000 km2 (3,500 mi2) of Precambrian igneous and metamorphic rocks (Johnson et al., 1976). The central part of the Llano region is an oval topographic basin composed mainly of Precambrian rocks surrounded by highlands of more resistant Paleozoic and Mesozoic sedimentary rocks (Fig. 1). Paleozoic sedimentary units occur in the central portion of the basin as erosional remnants and downfaulted blocks (Freed, 1986).
The Riley Formation is the oldest Cambrian unit in the Llano Uplift area. The formation is divided into three gradational members, the Hickory sandstone, Cap Mountain sandy limestone, and Lion Mountain sandstone in ascending order (Fig. 2). In general two regional stratigraphic relationships largely control the distribution and thickness of the Hickory (Barnes and Bell, 1977): (1) the Hickory overlies unconformably on the rugged surface of Precambrian crystalline rocks. In consequence the Hickory, or even the overlying Cap Mountain, may be absent at topographic highs; and (2) the contact between the Hickory and Cap Mountain is in places gradational. These two relationships account for the irregularity in thickness and distribution of the Hickory. The greatest thickness measured for the Hickory is 177 m (530 ft) in the Llano area (Barnes, 1959).
The Hickory sandstone is generally divided into three facies. The lower facies is a fine- to very coarse-grained, poorly sorted sandstone with subrounded to rounded grains and minor amounts of siltstone and shale laminae. A conglomerate is present at the base. The middle facies which interfingers with the lower facies consists of fine- to coarse-grained sandstone interbedded with siltstone and shale laminae. Minor to intense bioturbation and soft sediment deformation are pervasive. The upper facies is generally medium- to coarse-grained, well rounded, hematitic sandstone. The amount of hematite cement varies between beds, but the highest concentration occurs near the top.
The Cap Mountain is mostly sandy limestone interbedded with gray to green, irregular shale laminae. Lenses enriched in glauconite and fossil fragments are present. Of particular note are the presence of fractures throughout, which are often filled with silt, shale, and calcite.
Cornish (1975) determined that the Hickory and Cap Mountain sediments were deposited in estuarine and tidal flat environments. El-Jard (1982) studied the diagenetic alterations of the Hickory and concluded that much of the existing porosity is of secondary origin. Hydrogeological studies of the Hickory aquifer have been reported by Black (1988) for Mason and McCulloch Counties, and by Pettigrew (1991) for San Saba County.
MATERIALS AND METHODS
Cores recovered from two Texas Water Development Board (TWDB) test wells provided materials for this study. The State Well #42-62-909 is located about 11 km (7 mi) south of the city of Brady, and the Weimer Stratigraphic Test Well KK 5750231 is located on city property in the city of Fredericksburg. In this report, the two wells will be referred to as the Brady and the Fredericksburg test well respectively.
The core taken from the Brady test well is continuous from the Ordovician Ellenburger limestone at the surface to the Precambrian metamorphic rocks (Fig. 2). The total length of the core is approximately
End_Page 317------------------------
464 m (1,522 ft), covering the lower Ordovician and all of the Cambrian section. The Hickory measures 136 m (445 ft), and the Cap Mountain 44 m (143 ft) in thickness at this locality. From the Fredericksburg test well only selected intervals were cored, with a total length of 49 m (160.8 ft). Most of the cored intervals, however, represent the Hickory.
A complete description of each core in terms of lithology, texture, and sedimentary structures was made prior to sampling. For the Brady test well subsurface data, including the natural gamma ray spectrometry logs, chemical logs, and water chemistry data, were also made available by the TWDB. Samples were selected where high uranium or thorium concentrations are indicated in logs, or suspected based on mineralogical and textural characteristics. A total of 90 samples were selected from the Hickory and Cap Mountain of the Brady test well for thin section and uranium analysis. Selection of samples from the Fredericksburg test well, a total of 124 samples, was based strictly on rock composition and texture, because no subsurface data was available.
The mineralogical composition of each sample was determined by point counting of 150 points on a polished thin section with a petrographic microscope. Three categories determined are detrital grains, authigenic minerals, and porosity. For sand texture, the long axis of 50 randomly selected quartz grains were measured. During petrographic analysis the diagenetic history, and nature and abundance of uranium- and thorium-bearing minerals were also noted. Where positive identifications of these minerals were necessary they were studied by electron probe microanalysis methods.
Uranium concentrations in bulk samples were determined by the delayed-neutron counting (DNC) method. Sample preparation involves crushing, grinding, splitting, and drying; details are described in Ledger (1981). For this study two types of samples were selected for analysis, sandstones and shales. Shales include all those which are composed predominantly of clay and silt size detrital materials.
Each powdered and weighed sample was placed in a polyvial and irradiated for 60 seconds at a thermal neutron flux of 9.63  1012 neutrons/cm2/sec. A 20 second delay, before counting for 60 seconds with a 10BF3, counter, allows the decay of short half-lived isotopes such as N17 (half-life of 4 seconds). The sample was then compared to standards of known uranium concentration.
Most of the counts result from the fissioning of U-235 with thermal neutrons. The presence of fast neutrons in the flux produce fissioning of Th-232 and U-238 with subsequent emission of neutrons that are counted as uranium which interfere the principal uranium counts. The thorium contribution to the total counts depends on the amount of thorium in the sample, the amount of uranium in the sample, and the proportion of fast neutrons to thermal neutrons in the flux. Ferreira et al. (1975) reported that a Th/U ratio of 1 resulted in a thorium contribution of about 1.37 % to the net count.
The precision of the DNC method are generally ±5 % due to sample inhomogeneity, instrumental errors, interference, statistical errors, and operator errors. Thorium results from DNC analysis were not useful due to serious uranium interference. The analyses of uranium were performed by staff at the Nuclear Science Center, Texas A&M University.
Selected samples were analyzed for thorium concentrations by gamma-ray spectrometry. Gamma rays emitted by natural decay were counted from each disaggregated sample, about 500 g in weight, for approximately 24 hours. The Marinelli beaker was placed on the scintillation detector, a 7.6 7.6 cm (3 3 inch) cylindrical thallium-drifted sodium iodide crystal. The scintillations are converted in a 10-stage photomultiplier tube, producing direct-current pulses that are immediately preamplified and sent to a multichannel analyzer. The height of each DC pulse is proportional to the energy of the incident gamma ray released by the decay of the radionuclides. The pulses are constantly sorted by the multichannel analyzer, producing a histogram (spectrum) of the gamma-ray photons. Energies monitored were the 352 KeV line from the decay of Pb-214 and the 609 KeV line from the decay of Bi-214 in the U-238 decay series and the 2,615 KeV of Tl-208 in the Th-232 decay series. Data were loaded into a dedicated Hewlett-Packard 9836 computer and evaluated by a program (UTHCALC) written by one of us (EBL), which compared the sample to known standards. The thorium standard was prepared by mixing New Brunswick Laboratories #83A ThO2 ore sample, which is in secular equilibrium, with Ottawa sand (Ledger, 1981). The analyses of thorium were performed by personnel at the Department of Geology at Stephen F. Austin State University, Nacogdoches, Texas.
The distribution and occurrence of uranium in a rock on the microscopic scale was determined using fission-track analysis.
Figure 1. Simplified geologic map of the Llano Uplift area showing general distribution of major rock units, and locations (B and F) of the two test wells from which samples were selected for this study. Also shown in heavy line is the subcrop outline of the Hickory - Cap Mountain (modified from Texas Department of Water Resources, 1984 and Geological Highway Map of Texas, 1973).
Figure 2. Stratigraphic nomenclature of the lower Paleozoic sedimentary rocks in the Llano Uplift area.
End_Page 318------------------------
Fission-track analysis is based on the fact that energetic fission fragments produced by U-235 (fissioned by thermal neutrons), and U-238 and Th-232 (fissioned by fast neutrons) cause damage trails in the structure of materials immediately around the sample, which are preferentially enlarged to microscopic dimensions by etching with a suitable reagent. Fission-tracks up to 14  m long are produced in Lexan polycarbonate plastic detectors and are etched for enhanced visibility. This technique produces a "uranium map" which was employed in this study to determine the modes of uranium occurrence in the thin sectioned samples.
A total of 114 thin sections were cleaned with distilled water, covered with a 0.25 mm thick polycarbonate plastic detector, wrapped in aluminum foil, and then irradiated with a flux of thermal neutrons of 1 1012 neutrons/cm2/sec for 3 hours, at the TRIGA research reactor of the Nuclear Science Center of Texas A&M University. After a two-week wait for short-lived nuclei to decay, the detectors were removed from the thin sections and etched in 6N NaOH at 50°C for approximately 1 hour (Fleischer, 1966).
A uranium glass standard (NBS Standard Reference Material 963A - U concentration is 0.82 ppm) was irradiated with each batch
Figure 3. Uranium (A) and thorium (B) concentrations versus sample depth for the Brady test well. For uranium, open circles represent sandy samples and solid circles shaly samples. For thorium, no distinction between sandy or shaly samples was made. Also shown are the uranium and thorium spectral log records.
Figure 4. Uranium (A) and thorium (B) concentrations versus sample depth for the Fredericksburg test well. For uranium, open circles represent sandy samples and solid circles shaly samples.
Table 1. Summary of petrographic data of samples from the Brady test well.
End_Page 319------------------------
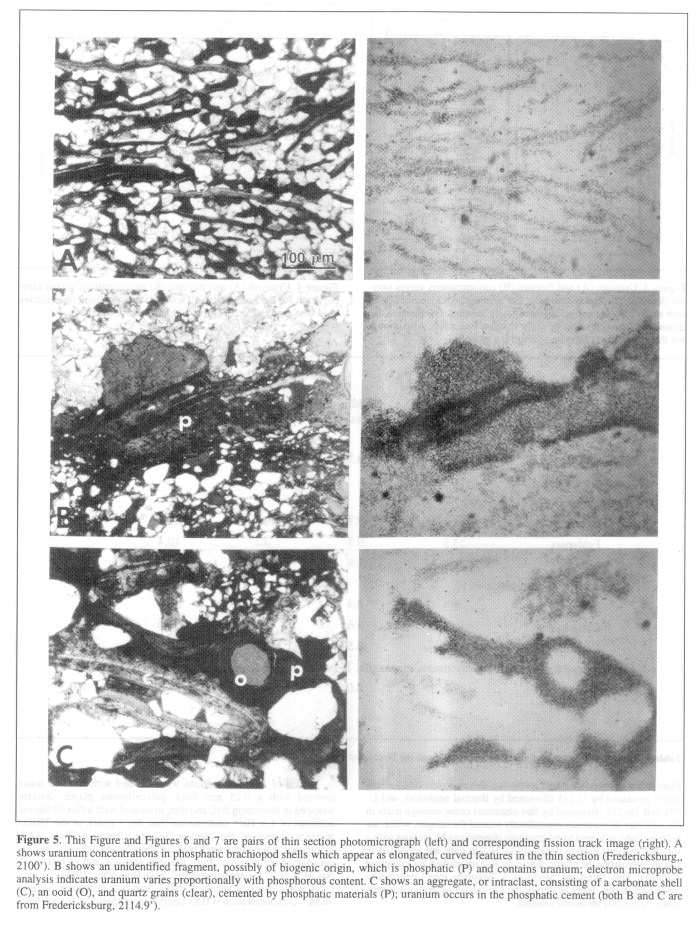 FIGURE 5. [Grey Scale] This Figure and Figures 6 and 7 are pairs of thin section photomicrograph (left) and corresponding fission track image (right). A shows uranium concentrations in phosphatic brachiopod shells which appear as elongated, curved features in the thin section (Fredericksburg, 2100
 ). B shows an unidentified fragment, possibly of biogenic origin, which is phosphatic (P) and contains uranium; electron microprobe analysis indicates uranium varies proportionally with phosphorous content. C shows an aggregate, or intraclast, consisting of a carbonate shell (C), an ooid (O), and quartz grains (clear), cemented by phosphatic materials (P); uranium occurs in the phosphatic cement (both B and C are from Fredericksburg, 2114.9).
End_Page 320------------------------
of thin sections. Comparison of the track density of the standard to that of the thin sections allowed an estimate of uranium concentrations.
Selected thin section samples were studied with a Cameca SX-50 electron microprobe to determine the chemistry of uranium- and thorium-bearing phases.
RESULTS
Texture and Composition
A summary of petrographic data of sandstone samples representative of the lower, middle, and upper facies of the Hickory and sandy limestones of the Cap Mountain from the Brady test well is presented in Table 1. In this test well the exact stratigraphic position of each sample is known. Texturally, there is little difference in the averages of mean grain size between these units. The overall average for all samples studied is 0.3 mm. It should be pointed out that the very coarse-grained to conglomeratic sandstones in the lower Hickory were less represented in the samples. Nevertheless, the whole section contains dominantly fine- to medium-grained sandstones.
The bulk rock compositional data are presented as framework grains, authigenic minerals, and porosity. Framework grains, on the average, constitute 62 % of the bulk rock, and are composed of quartz, feldspar, and some lithic fragments. The samples are subarkoses to quartz arenites. Of importance to note are the lithic fragments, which are largely intraclasts and biogenic fragments, and some have high uranium content as will be shown later. Table 1 shows that the major authigenic and cementing minerals vary in mineralogy and abundance. Notably the upper Hickory has an average of 28.3 % hematite, and the Cap Mountain, a sandy limestone, contains 34.6 % calcite. Other authigenic minerals present in minor quantities are kaolinite, chlorite, and glauconite.
Petrographically determined porosity, average 8 percent, is much lower than the average value of 23 percent determined from the porosity log. This is, in part, because during irradiation of the thin sections, the dye used in impregnating the sample faded in color and rendered recognition of porosity difficult. Textural and geometric characteristics of the pores indicate that much of the porosity is of secondary, or dissolution origin, an observation also made by El-Jard (1982) in his study of the Hickory.
Because of their known high uranium and thorium content, accessory minerals were counted separately from other framework
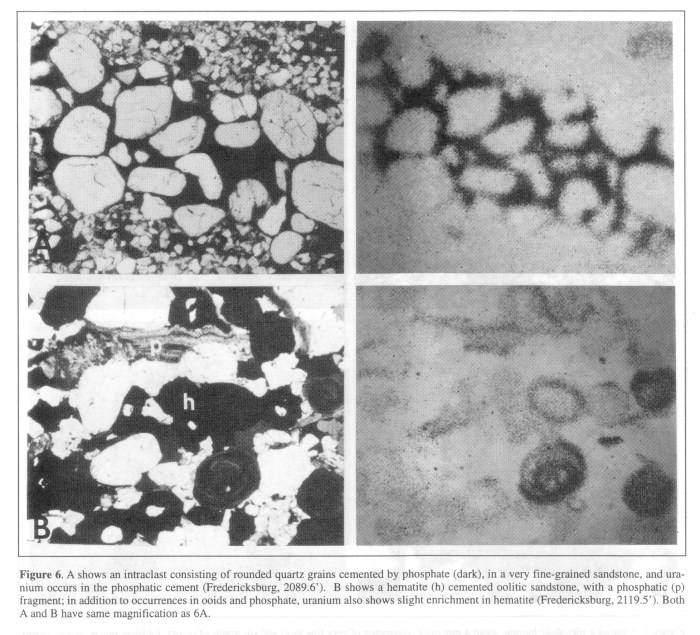 FIGURE 6. [Grey Scale] A shows an intraclast consisting of rounded quartz grains cemented by phosphate (dark), in a very fine-grained sandstone, and uranium occurs in the phosphatic cement (Fredericksburg, 2089.6). B shows a hematite (h) cemented oolitic sandstone, with a phosphatic (p) fragment; in addition to occurrences in ooids and phosphate, uranium also shows slight enrichment in hematite (Fredericksburg, 2119.5). Both A and B have same magnification as 6A.
End_Page 321------------------------
grains. These minerals constitute less than 1 % of the bulk rock. They are dominated by zircon (42 %) and opaques (33 %), with minor Ti-oxides (14 %) and monazite (9 %). Traces of apatite, epidote, garnet, and tremolite-actinolite are also present.
ABUNDANCE OF URANIUM AND THORIUM
Results of uranium and thorium analysis of samples from the two test wells are shown in Figures 3 and 4. For uranium analysis we sampled sandy and shaly samples separately based on visual examinations, because of the relatively small sample size required. For thorium analysis, where about 500 g of sample was needed for each determination, no attempt was made to separate the frequently present shale laminae from the sandstones. Figure 3A and 3B also show the uranium and thorium spectral logs recorded by Halliburton Logging Services, INC. and Schlumberger Well Services Co. for the Brady test well.
Samples from the two test wells show uranium concentrations vary from a minimum of 0.8 ppm to a maximum of 8.5 ppm, with an overall average of 3.8 ppm. For thorium, the concentrations vary from 8.4 ppm to 18.6 ppm, with an overall average of 13.7 ppm. The Th to U ratio is 4.4 for samples where both elements were analyzed. Except for a slightly higher average U concentration in the lower Hickory, possibly due to the somewhat less compositional maturity than the overlying sediments, there is no discernible stratigraphic variations in either U or Th in the section. A distinctive feature in uranium concentration, however, is the generally persistent higher uranium concentration in the interbedded shaly samples than in the sandy samples (Figs. 3A and 4A). The shaly samples have an overall average of 5.0 ppm, compared to 2.7 ppm for sandy samples. Figure 3B also shows the generally good agreement between thorium concentrations determined in the laboratory and that recorded on thorium spectral log from the test well.
 FIGURE 7. [Grey Scale] A shows a silty shale lamina, about 4 mm thick, consisting of very fine sand and silt grains of quartz, feldspar, micas, and accessory minerals in a clay matrix; dense track concentration areas are from accessory minerals, the lighter tracks in the shale are from uranium associated with detrital clay minerals (Brady, 1508). B shows the association of uranium with accessory minerals (arrows); all crystals of accessory minerals are zircon, except the one at lower right which is monazite (Fredericksburg, 2285.9). Note scale of B is different from all the others.
End_Page 322------------------------
MODES OF URANIUM OCCURRENCE
Fission track imaging of all thin sections shows that uranium in the Hickory sandstone and the Cap Mountain sandy limestone occurs primarily in four distinctive modes: (1) in phosphatic materials including fossil shell fragments and intraclasts cemented by phosphate; (2) in thin shaly laminae enriched in phyllosilicates; (3) in authigenic minerals including hematite and clay minerals; and (4) in detrital accessory minerals.
Shown in Figures 5, 6, and 7 are pairs of thin section photomicrograph and corresponding fission track detector of the same field of view. All photomicrographs were taken with plane light. The tracks appear as small dots on the detector, and dot density is proportional to uranium concentration. Where the elemental composition is indicated on the thin section photomicrograph, it is determined by electron microprobe analysis.
Phosphatic materials in these Cambrian sediments occur in two general forms; as shell remains of brachiopods or unidentified fossils and as cementing material of intraclast fragments, with or without clay minerals. These materials are most common in the upper Hickory and the Cap Mountain. Figures 5A, 5B, 5C, and 6A show the close association of uranium with phosphatic materials. In Figure 5A cross sections of brachiopod shells appear as elongated, slightly curved features in a sandstone; some show the effect of compaction. The corresponding detector shows uranium enrichment in these shells. The estimated uranium concentration, when compared with the standard, is on the order of 10 to 20 ppm. The area in the middle of Figure 5B is an unidentified phosphatic fragment of biogenic origin. Uranium concentration varies in the fragment as shown in the corresponding detector. The two darker bands in the middle are more enriched with uranium, on the order of 50 ppm. These areas also have higher phosphorous content as revealed by electron microprobe analysis.
Phosphatic material also occurs as a cementing agent of intraclasts, or growth bands of some ooids. Figure 5C shows an intraclast with a carbonate shell, quartz grains, and ooids in a phosphatic cement. Figure 6A shows an intraclast composed of rounded quartz grains cemented by phosphate, in a much finer grained sandstone host. Phosphate cement invariably shows significantly high (on the order 50 ppm) uranium content. All phosphate materials are poorly crystalline, or cryptocrystalline; they do not show any birefringence between crossed polars.
A slight enrichment of uranium occurs in hematite cement. Hematite is most abundant in the upper Hickory (Table 1), and is present in varying amounts in sandstones and siltstones throughout the section. Shown in Figure 6B are hematitic ooids and hematite cement that contain noticeably higher uranium than the background. Uranium associated with hematite is generally variable, but the concentration is relatively low, probably less than 10 ppm. However, when the abundance and common presence of hematite in the section is considered, this mode of occurrence becomes significant.
Enrichment of uranium in shales and silty shales has been shown in bulk sample analysis (Figs. 3A and 4A). Figures 7A further illustrates this relation. Shown in Figure 7A is a thin ( 4 mm thick) silty shale consisting of fine-sand to silt-size particles of quartz, feldspars, and micas in a matrix of detrital clays. The dense tracks in the detector, which appear as larger dots, are from silt-size accessory minerals, mostly zircon. The unevenly distributed tracks of the background reflect close association of uranium with detrital clays.
In accessory minerals the occurrence of uranium as ionic substitution is well known, especially for zircon and monazite. The sandstone shown in Figure 7B has several crystals of zircon and one monazite. The very dense tracks derived from these grains indicate that uranium concentration in these minerals is greater than 200 ppm. Electron microprobe analysis of selected sand grains of zircon and monazite, from grain center to margin, does not show any recognizable sign of uranium leaching from these grains. However, when present in very fine particles (as fine silt and clay), the increased surface area may facilitate uranium release.
DISCUSSION
The Hickory sandstone and Cap Mountain sandy limestone have detrital compositions of subarkosic sands, reflecting their derivation from the underlying Precambrian granitic and metamorphic rocks. These sediments have generally higher uranium and thorium contents than the averages for sandstones and shales reported by Rogers and Adams (1969) and Rich et al. (1977). Uranium and thorium in granites and granitic rocks in the Llano Uplift area have been reported by Tieh et al. (1980) and Tieh and Ledger (1981). Bulk rock concentrations of both uranium and thorium found in this study fall between that found in unweathered granite and that in soils and stream sediments derived therefrom. An important observation of this study, however, is the redistribution of uranium during weathering, depositional and post-depositional stages as revealed by the modes of uranium occurrence in these Cambrian sediments, which are very different from the granitic source rocks.
Because of the high mobility of uranium in oxidizing conditions, much of the uranium in granites, with the exception of that in accessory minerals, is brought into solution in some form of uranyl complex during weathering. Uranium in solution can be scavenged by oxyhydroxides of iron and titanium (Lowson et al., 1986; Stearns, 1992). The slight uranium enrichment in hematitic materials, often accompanied by the presence of a small amount of titanium when analyzed with the electron microprobe, tends to further illustrate this relation. Marine phosphatic materials, whether of biogenic or nonbiogenic origins, invariably contain high concentrations of trace metals, one of which is uranium. In the samples studied the phosphates are, by electron microprobe analysis, generally of the carbonate fluorapatite type. In the study of the mode of uranium incorporation in phosphates, Altschuler et al. (1958) proposed that U substitutes for calcium within the apatite lattice as U4+ which has a virtually identical ionic radius (1.05  ) to that of Ca2+ (1.06 ). Although UO22+ ion can be fixed in apatite without prior reduction to U4+, as demonstrated experimentally by Ames (1960), the larger size of UO22+ precludes a direct substitution for Ca2+ in the apatite lattice. The occurrence of U6+ in phosphates has been variously explained either as a result of chemisorption of uranyl ions on apatite crystals, or as a result of post-depositional oxidation of primary U4+ (Burnett and Veeh, 1977). Subsequent oxidation of uranium originally incorporated as U4+ may depend on the degree of exposure to oxidizing environments and the amount of auto-oxidation of 238U4+ to 234U6+ during radioactive decay (Altschuler et al., 1958; Burnett and Gomberg, 1977). Uranium probably substitutes for calcium, but these materials, both in biogenic fragments and cement, are poorly crystalline. The close association of uranium with shaly sediments, particularly black shales, is well known. In the Hickory and Cap Mountain this is manifested by the uranium data (Figs. 3A and 4A) as well as fission track imaging (Fig. 7A). However, these shaly samples do not seem to have high contents of organic materials typical of black shales. A significant part of the uranium in these shaly sediments most likely is adsorbed onto clay minerals.
While the detrital accessory minerals show the highest concentration of uranium (Fig. 7B), they occur only in trace amounts in the section, and they seem to have maintained their "resistate" nature, i.e. resistance to alteration, at least for the sand size particles. It is difficult to assess their contribution to radionuclides in groundwater of the area.
Uranium associated with hematite, phosphatic materials, and clays, however, can be interactive with groundwater, because it is not tightly held in crystal structures such as the accessory minerals. The average porosity for the Hickory sandstones, as determined from log records is 23 %. When the sediment is saturated, a significant portion of the uranium-bearing phases can be in direct contact with water, and thus release uranium as well as its decay products to the water.
End_Page 323------------------------
Wanty et al. (1992) formulated a model which accounts for the generation of radon from U-238 in rocks and its transfer to groundwater. The radon flux model is expressed as
K p Vt ([1- ]/[]) E [U]rock = (Rn)water
where K = a constant, 337,
r = bulk density of rock (kg/dm3),
Vt = volume of rock (dm3),
= porosity (%),
E = emanating efficiency (%),
[U]rock = uranium concentration in rock (ppm), and
(Rn)water = 222Rn in water (pCi/l).
The constant, K, is derived by using appropriate conversion factors.
An estimate of Rn-222 concentration in water produced from the Hickory and Cap Mountain can be obtained by using the above relation with the following parameters:
r = 2.7 kg/dm3,
= 23 %,
E = 10 %, and
average [U]rock = 3.8 ppm.
The estimate is 1,160 pCi/l. Cech et al. (1988) presented Rn-222 concentration data for waters derived from the Hickory sandstone and the Ellenburger-San Saba limestone aquifers of Concho, McCulloch, and San Saba Counties. The data do not specify the units where the water samples were obtained. Their data, however, show that radon concentrations vary from less than 100 to more than 1,400 pCi/l, with a mean concentration of 400 pCi/l. Accurate determinations of radon yield from the Hickory and Cap Mountain aquifers would require careful and systematic sampling of the water for extended period of time. The estimate of 1,160 pCi/l shown above, therefore, can be considered to be in generally good agreement with the available radon data.
CONCLUSIONS
The Cambrian Hickory sandstone and Cap Mountain sandy limestone in the area surrounding the Llano Uplift in central Texas are subarkosic in composition. These aquifer rocks contain relatively high uranium and thorium, with averages of 3.8 ppm and 13.7 ppm, respectively. Uranium occurs in close association with phosphatic materials, interbedded shale laminae and, to a lesser extent, hematitic cement. As expected, uranium is also concentrated in detrital accessory minerals which are present in trace amounts. From the abundance, distribution, and nature of occurrence of uranium and the abundance data of thorium, and considering the generally porous nature of the rocks, it is concluded that decay of these natural radionuclides can generate the radium and radon anomalies observed in the groundwater produced from the aquifer.
Pay-Per-View Purchase Options
The article is available through a document delivery service. Explain these Purchase Options.
| Watermarked PDF Document: $14 | |
| Open PDF Document: $24 |