About This Item
- Full text of this item is not available.
- Abstract PDFAbstract PDF(no subscription required)
Share This Item
The AAPG/Datapages Combined Publications Database
GCAGS Transactions
Abstract
Abstract: Interactive 3-D Visualization of Sonar Survey and Other Data Types for Analysis of Displaced Infrastructure and Seabed Sediments following a Gulf of Mexico Hurricane Event
Abstract
Our presentation relies upon commercial visualization software to portray three-dimensional views of seabed and pipelines using data collected after the passage of Hurricane Ivan (2004) (Fig. 1). Data from a variety of sources are displayed in a common geospatial setting. Principal data types include geophysical data plus engineering models and geographic mapping elements.
Using selected tools we co-visualized the integrated datasets and analyzed the degree of pipeline displacement following the storm (Fig. 2). The method included "fly-through" of the rendered scene. The collaborative visualization environment led to rapid understanding of storm effects, including the types of seabed failure leading to pipeline movement. Rapid identification of post-storm conditions was vital to our remedial response. The visualization technique led to enhanced decision making regarding proper engineering response. We relied in part on BP's Highly Immersive Visualization Environment (HIVE) setting to review data interpretations with multidisciplinary teams. The ability to interactively add or remove elements and to selectively vary transparency revealed key spatial relationships. Similarly, rotating the data and viewing it in perspective from multiple angles (Fig. 3) yielded insights otherwise not obtainable. Results of our analysis will be used better to understand the effects of large-scale storms on seabed sediments and will allow us to prepare for future events.
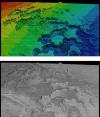
Review of the integrated dataset revealed that the most significant pipeline displacements occurred in water depths less than 300 ft. The largest of these was noted in block MP144 where a section of pipeline, approximately 27.5 mi in length, was found displaced to a maximum of 1,900 ft (Fig. 2). The presence of scour marks on the seabed suggest the mass movement of, bottom sediments contributed to the pipeline displacement. A second area of pipeline movement apparently caused by seabed failure is in blocks MP 72 and 73 (Figs. 4 and 5), as indicated by mud lumps and disturbed bottom sediments. Our survey in MP225 (Fig. 3) found minor pipeline movement and significant rock outcrop. More details of survey results were presented earlier (Thomson et al., 2005).
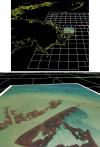
The use of visualization software together with the HIVE allowed us to assess rapidly post-storm high-resolution sonar data and establish the status of pipeline assets. Co-visualization of multiple data types demonstrated the spatial relationships between geoscience, engineering and cultural data (Figs. 6 and 7). Business benefits resulting from this methodology include more efficient use of scarce resources and faster, more confident restart of pipeline operations based on an understanding of subsea conditions.
References
Thomson, J., M. Garrett, M. Taylor, T. George, M. Melancon, and K. Behrens, 2005, Sonar surveys for pipeline inspection show extent of pipeline displacement and seafloor instability following Hurricane Ivan: Proceedings of the 2005 Offshore Technology Conference, Paper 17738, Houston, Texas, 8 p.
 Figure 1. Location map showing Mississippi River delta for reference. MPOG (Main Pass Oil Gathering) pipeline is shown in magenta.
 Figure 2. Areas of lateral displacement along MPOG pipeline.
![]() Figure 3. MP225 area showing outcrop and pipeline position from pig run. Darker sonar reflection indicates harder seafloor material.
Figure 3. MP225 area showing outcrop and pipeline position from pig run. Darker sonar reflection indicates harder seafloor material.
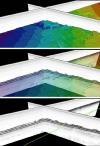
 Figure 4. Relationship between seabed topography and underlying stratigraphy as revealed by varying transparency of rendered seabed surface, MP72-73 area. Transparency increases from top to bottom image.
 Figure 5. Identical views of mud slide area, MP72-73. Rendered seafloor, above, shows separated sediment blocks. Color scale varies with water depth from red (shallow) to blue (deep). Backscatter data show additional details (bottom image).
 Figure 6. Aerial photography data combined with cultural and engineering data show conditions where water depths are too shallow for survey vessels.
![]() Figure 7. Chart showing area of maximum pipeline displacement, MP144 area (Fugro Survey).
Figure 7. Chart showing area of maximum pipeline displacement, MP144 area (Fugro Survey).
Acknowledgments and Associated Footnotes
1 BP America, Inc., 501 Westlake Park Blvd., Houston TX 77079
2 BP America, Inc., 501 Westlake Park Blvd., Houston TX 77079
3 BP Pipelines (North America), Inc., 200 Westlake Park Blvd., Houston TX 77079
The authors wish to thank BP Pipelines (North America) Inc. for permission to publish this extended abstract.
Copyright © 2007 by The Gulf Coast Association of Geological Societies
