About This Item
- Full text of this item is not available.
- Abstract PDFAbstract PDF(no subscription required)
Share This Item
The AAPG/Datapages Combined Publications Database
West Texas Geological Society
Abstract
Abstract: Offset Dependent Attribute Scanning: A Seismic Interpretation Tool and  Data
Data Evaluation Technique
Introduction
Information that may be useful for evaluation and interpretation of seismic ![]() data
data![]() can be obtained by comparing attributes of two migrated profiles utilizing different offset ranges for the CDP stacks. Although these methods will not yield precise information about rock properties, they do provide a quick and robust method for identifying processing problems, for recognizing major variations in rock types, and as an aid in correlation across faults.
can be obtained by comparing attributes of two migrated profiles utilizing different offset ranges for the CDP stacks. Although these methods will not yield precise information about rock properties, they do provide a quick and robust method for identifying processing problems, for recognizing major variations in rock types, and as an aid in correlation across faults.
Methods
Although any two ![]() common
common![]()
![]() offset
offset![]() range stacked
range stacked ![]() data
data![]() sets can be compared, we use ranges that are of equal fold so that the signal to random noise ratio will be about equal between
sets can be compared, we use ranges that are of equal fold so that the signal to random noise ratio will be about equal between ![]() data
data![]() sets at all reflection times. We vary the offset ranges as a function of time so that fold of stack remains equal between
sets at all reflection times. We vary the offset ranges as a function of time so that fold of stack remains equal between ![]() data
data![]() sets at all reflection times.
sets at all reflection times. ![]() Data
Data![]() for analysis are selected on amplitude and on their relative position within the wavelet. In this way the analysis can be restricted to
for analysis are selected on amplitude and on their relative position within the wavelet. In this way the analysis can be restricted to ![]() data
data![]() that is well above the noise level or that is near a peak, trough, or zero crossing. The selection can be done so that comparisons are robust and yet allow enough
that is well above the noise level or that is near a peak, trough, or zero crossing. The selection can be done so that comparisons are robust and yet allow enough ![]() data
data![]() to be analyzed to qualitatively evaluate phase and frequency variations.
to be analyzed to qualitatively evaluate phase and frequency variations.
Both amplitude and spectral dependent comparisons are made between ![]() data
data![]() sets. A special amplitude independent transform which is similar to the well known instantaneous phase (Hilbert) transform is made of both
sets. A special amplitude independent transform which is similar to the well known instantaneous phase (Hilbert) transform is made of both ![]() data
data![]() sets. By comparing both amplitude and transform relationships, anomalies can sometimes be classified as petrophysical, geometric (thin bed), or false.
sets. By comparing both amplitude and transform relationships, anomalies can sometimes be classified as petrophysical, geometric (thin bed), or false.
Use for Geologic Interpretation
Figures 1a, 1b, and 1c show displays from a seismic profile on the Central Basin Platform. Figure 1a is a full range migrated stacked profile. Production occurs in the lower Clearfork and Devonian formations and seems to be expressed on the offset attribute scan sections. The lower Clearfork production is characterized by the far trace reflection strength being less than the near trace reflection strength (Fig. 1b). In the non-productive part of the lower Clearfork this relationship is reversed. A transform anomaly is associated with the upper porosity zone in the lower Clearfork (Fig. 1c).
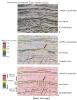 Figure 1.
Fractured Devonian reservoir (indicated by arrows), on the other hand, is expressed as a rather dramatic difference in the coherence between near and far offset range stacks (Fig. 1b and 1c). Very little or no variation in the amplitude with offset is observed across this production.
Finally, offset dependent variations in amplitude (Fig. 1b) and phase (Fig. 1c) assist in the correlation of Ellenburger, Waddell, and other Simpson reflectors across faults.
Evaluation of Data
Figures 2a, 2b, 2c, and 2d are different displays of a seismic line from the Palo Duro Basin in an area where there is severe solution and collapse in the near surface (please refer to color scale shown in figure 1). The full offset stacked section (Fig. 2a) exhibits good coherence and signal to noise ratio for ![]() data
data![]() from this area. The amplitude ratios of near and far range sections shown in figures 2b and 2d at two different time scales, however, show considerable variation in both time and space. The time dependent variation results from characteristics of the spherical divergence correction and is attributed to inadequate gain for the later arrivals on the far traces.
from this area. The amplitude ratios of near and far range sections shown in figures 2b and 2d at two different time scales, however, show considerable variation in both time and space. The time dependent variation results from characteristics of the spherical divergence correction and is attributed to inadequate gain for the later arrivals on the far traces.
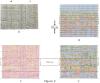 Figure 2.
There is also a variation across the section that appears as vertical bands (Fig. 2b and 2d). This type of variation could be due to poor gain recovery or to incorrect static and NMO corrections. The transform comparison shown in 2c, however, shows no such vertically aligned anomalies. Because transform comparisons are amplitude independent and very sensitive to phase variations, we conclude that static and NMO corrections are properly applied and that gain recovery is inadequate for any type of amplitude dependent analysis such as AVO or inversion. This amplitude variation could perhaps be corrected by surface consistent gain recovery techniques.
Conclusions
Comparison of attributes of seismic ![]() data
data![]() sets in sectional form is an efficient way to evaluate certain aspects of seismic
sets in sectional form is an efficient way to evaluate certain aspects of seismic ![]() data
data![]() quality and is an assistance in seismic interpretation. It is also a way to identify certain large AVO anomalies, but should not be considered an AVO analytic method. So far, however, our experience has shown this approach to be stable even in areas of weak signal to noises ratios.
quality and is an assistance in seismic interpretation. It is also a way to identify certain large AVO anomalies, but should not be considered an AVO analytic method. So far, however, our experience has shown this approach to be stable even in areas of weak signal to noises ratios.
Acknowledgments and Associated Footnotes
The authors would like to thank HGS and RAI for supporting these investigations. We also thank Gunn Oil Co. and Mobil E&P US Inc. for their invaluable aid in developing case histories.
1 Howard Renick, Jr.: Renick and Anderson, Inc., Midland, Texas
2 Steven L. Roche: Halliburton Geophysical Services, Inc., Midland, Texas
© 2024 West Texas Geological Society