The AAPG/Datapages Combined Publications Database
AAPG Bulletin
Figure
AAPG Bulletin; Year: 2015; Issue: June DOI: 10.1306/01191513190
Return to Full Text
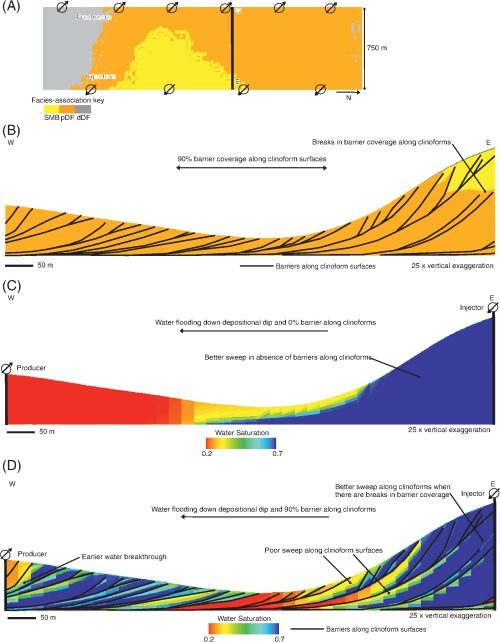
Figure 10
(A) Plan-view facies association map of the Ferron Sandstone Member extracted from our reservoir model (Figure 5D), showing location of injector and producer wells, and the cross section illustrated in Figure 10B–D. The color scheme is the same as in Figures 5D and 8A. (B) Depositional-dip-oriented cross section showing the internal facies architecture of the modeled parasequence with the location of flow barriers along the clinoforms shown as black lines. Flow barriers are placed stochastically along clinoforms according to a trend that decreases the probability of barriers being present along the upper part of a clinoform. (C, D) The same depositional-dip-oriented cross section showing water saturation after 5 yr of production where water has been injected down the depositional dip, from east to west, for models with (C) 0% barrier coverage along clinoforms and (D) 90% barrier coverage along clinoforms. Oil is bypassed below the clinoforms in (D). SMB = stream-mouth-bar; pDF = proximal delta-front; dDF = distal delta-front.
Figure 10 (A) Plan-view facies association map of the Ferron Sandstone Member extracted from our reservoir model (Figure 5D), showing location of injector and producer wells, and the cross section illustrated in Figure 10B–D. The color scheme is the same as in Figures 5D and 8A. (B) Depositional-dip-oriented cross section showing the internal facies architecture of the modeled parasequence with the location of flow barriers along the clinoforms shown as black lines. Flow barriers are placed stochastically along clinoforms according to a trend that decreases the probability of barriers being present along the upper part of a clinoform. (C, D) The same depositional-dip-oriented cross section showing water saturation after 5 yr of production where water has been injected down the depositional dip, from east to west, for models with (C) 0% barrier coverage along clinoforms and (D) 90% barrier coverage along clinoforms. Oil is bypassed below the clinoforms in (D). SMB = stream-mouth-bar; pDF = proximal delta-front; dDF = distal delta-front.