The AAPG/Datapages Combined Publications Database
AAPG Bulletin
Figure
AAPG Bulletin; Year: 2015; Issue: June DOI: 10.1306/01191513190
Return to Full Text
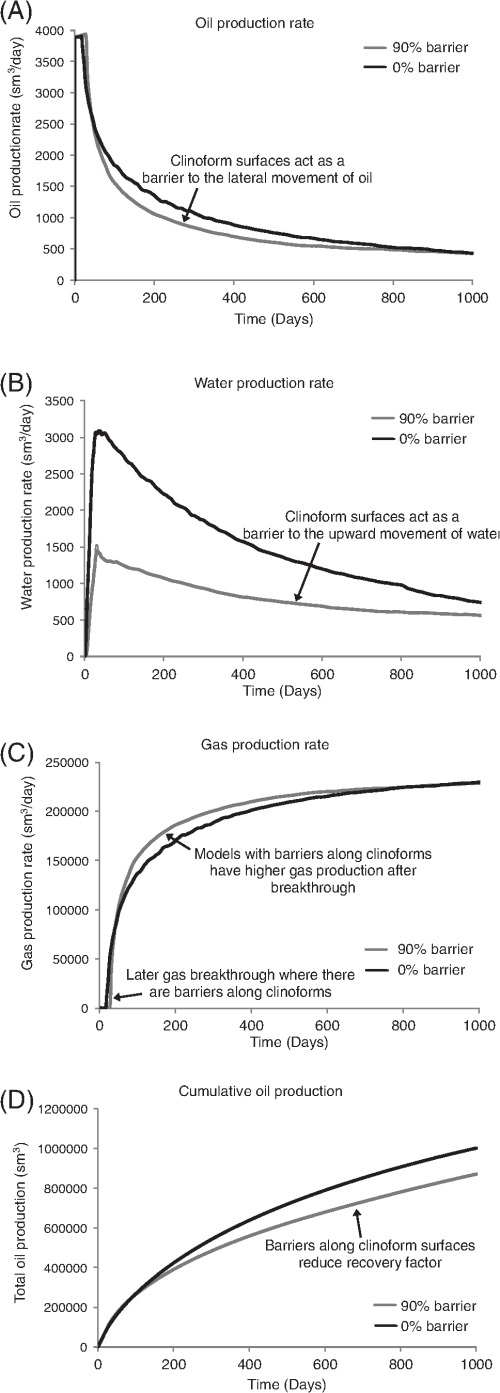
Figure 17
(A) Oil, (B) water, (C) gas production rates, and (D) cumulative oil production as a function of time in the simulation model of the Sognefjord Formation in a fault-bounded sector of the Troll Field (Figure 12B) for production from a single horizontal well through gas cap expansion and aquifer influx (Figure 16). In the models with 90% barrier coverage along clinoforms, free gas breakthrough is delayed (Figure 17C) and liquid production is decreased (Figure 17A, B, D) relative to the models lacking barriers along clinoforms.
Figure 17 (A) Oil, (B) water, (C) gas production rates, and (D) cumulative oil production as a function of time in the simulation model of the Sognefjord Formation in a fault-bounded sector of the Troll Field (Figure 12B) for production from a single horizontal well through gas cap expansion and aquifer influx (Figure 16). In the models with 90% barrier coverage along clinoforms, free gas breakthrough is delayed (Figure 17C) and liquid production is decreased (Figure 17A, B, D) relative to the models lacking barriers along clinoforms.