The AAPG/Datapages Combined Publications Database
AAPG Bulletin
Figure
AAPG Bulletin; Year: 2020; Issue: May DOI: 10.1306/11111917396
Return to Full Text
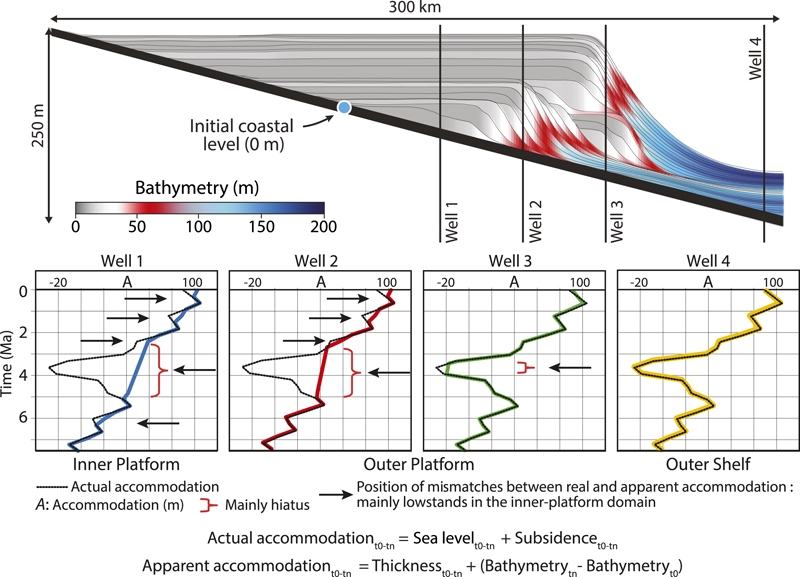
Figure 8. Comparison between actual and apparent accommodation curves in time, calculated from the modeled stratigraphic grids in the pseudowell locations. This figure illustrates precisely that mismatches between the two parameters correspond to lower accommodation cycles and subsequent hiatuses in the inner-platform domain. The actual amount of negative accommodation is not systematically recorded in locations where the accommodation is filled by carbonate production. t0 = 0 m.y.; tn = 5 m.y.
Figure 8. Comparison between actual and apparent accommodation curves in time, calculated from the modeled stratigraphic grids in the pseudowell locations. This figure illustrates precisely that mismatches between the two parameters correspond to lower accommodation cycles and subsequent hiatuses in the inner-platform domain. The actual amount of negative accommodation is not systematically recorded in locations where the accommodation is filled by carbonate production. t0 = 0 m.y.; tn = 5 m.y.