The AAPG/Datapages Combined Publications Database
AAPG Bulletin
Figure
AAPG Bulletin; Year: 2014; Issue: October DOI: 10.1306/04301413177
Return to Full Text
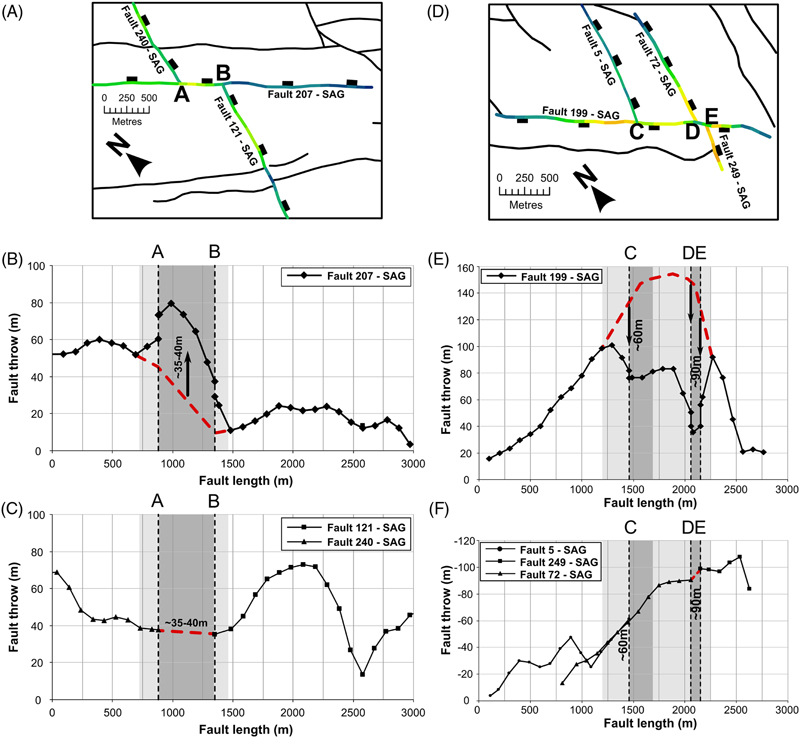
Figure 16. Fault-throw profiles showing examples of trailing fault interactions: (A), (B), and (C) show a synthetic trailing fault interaction in which two faults abut and reactivate a portion of another fault that shares the same motion sense. (A) Plan-view map of the fault interaction. In this case, fault 207 in (B) is reactivated between intersection points A and B, increasing in throw, because of the abutting interactions of faults 121 and 240 shown in (C); (D), (E), and (F) show an example of an antithetic trailing fault in which faults abut and reactivate a portion of another fault that has the opposite-motion sense. (D) Plan-view map of the fault interaction. In this case, fault 199 in (E) is reactivated between intersection points C and E, decreasing in throw, because of interactions with abutting faults 5, 249, and 72 shown in (F). The dashed lines are an estimated reconstruction of the original fault-throw profiles before interaction. See Figure 3C for the locations of these faults within the fault network.
Figure 16. Fault-throw profiles showing examples of trailing fault interactions: (A), (B), and (C) show a synthetic trailing fault interaction in which two faults abut and reactivate a portion of another fault that shares the same motion sense. (A) Plan-view map of the fault interaction. In this case, fault 207 in (B) is reactivated between intersection points A and B, increasing in throw, because of the abutting interactions of faults 121 and 240 shown in (C); (D), (E), and (F) show an example of an antithetic trailing fault in which faults abut and reactivate a portion of another fault that has the opposite-motion sense. (D) Plan-view map of the fault interaction. In this case, fault 199 in (E) is reactivated between intersection points C and E, decreasing in throw, because of interactions with abutting faults 5, 249, and 72 shown in (F). The dashed lines are an estimated reconstruction of the original fault-throw profiles before interaction. See Figure 3C for the locations of these faults within the fault network.