The AAPG/Datapages Combined Publications Database
AAPG Bulletin
Figure
AAPG Bulletin; Year: 2014; Issue: October DOI: 10.1306/04301413177
Return to Full Text
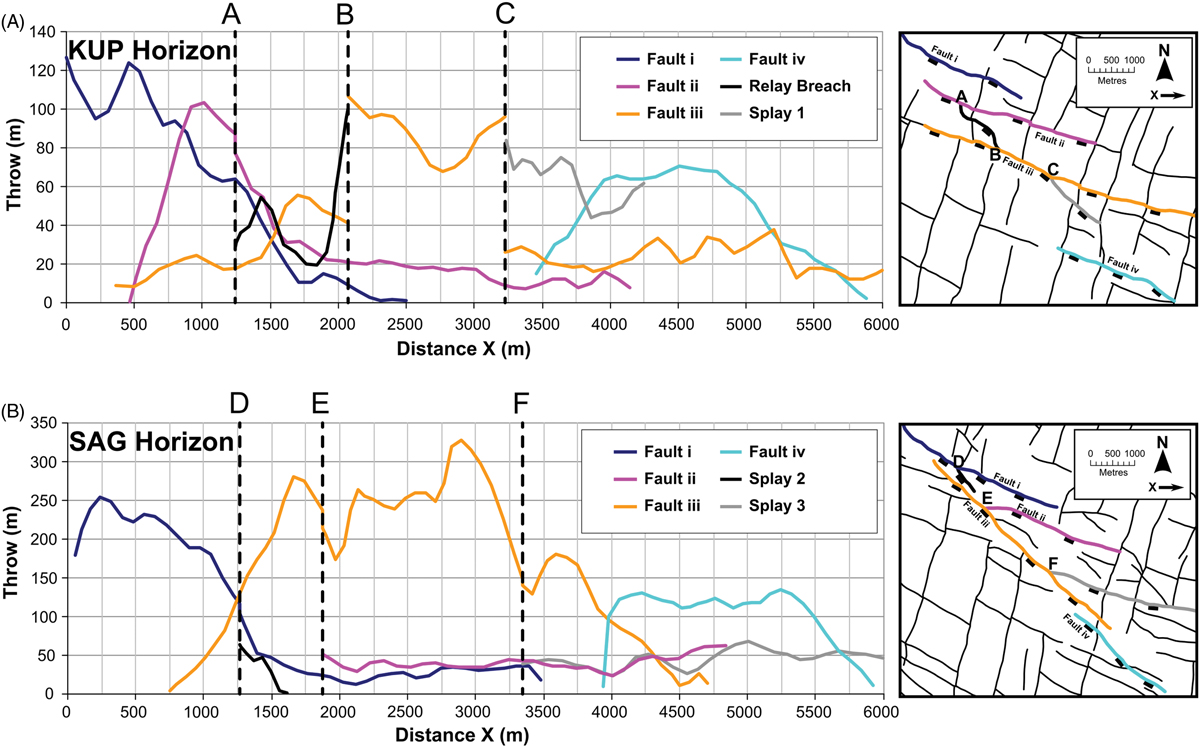
Figure 17. Fault-throw profiles from (A) the KUP horizon and (B) the SAG horizon of four large west-northwest–trending faults (Faults i, ii, iii, and iv) that share relay ramps and interact with each other with some associated splay faults. The plots show variations in throw for each fault along distance X, which increases to the east, indicating an increase in interaction, linkage, and a clockwise rotation with depth. To the right are plan-view maps of the interacting faults. See Figure 3C for the locations of these faults within the fault network.
Figure 17. Fault-throw profiles from (A) the KUP horizon and (B) the SAG horizon of four large west-northwest–trending faults (Faults i, ii, iii, and iv) that share relay ramps and interact with each other with some associated splay faults. The plots show variations in throw for each fault along distance X, which increases to the east, indicating an increase in interaction, linkage, and a clockwise rotation with depth. To the right are plan-view maps of the interacting faults. See Figure 3C for the locations of these faults within the fault network.