The AAPG/Datapages Combined Publications Database
AAPG Bulletin
Figure
AAPG Bulletin; Year: 2015; Issue: June DOI: 10.1306/01191513190
Return to Full Text
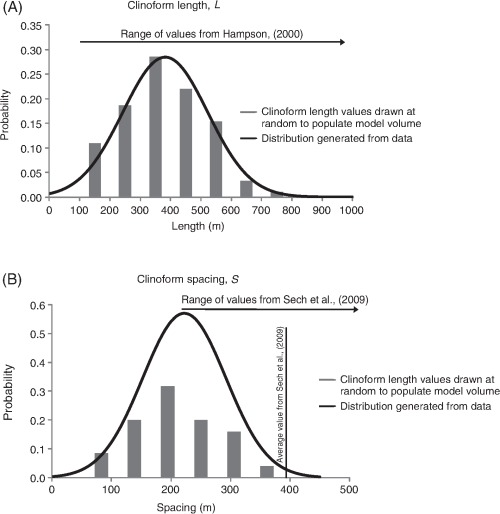
Figure 13
Normal distributions, shown as black lines, for (A) clinoform length (Figure 4D) and (B) clinoform spacing (Figure 4D) generated from published seismic data from the Sognefjord Formation (figures 3, 12 in Dreyer et al., 2005). Gray bars represent the values for clinoform length and spacing drawn at random from the normal distribution and used to populate the Troll sector model.
Figure 13 Normal distributions, shown as black lines, for (A) clinoform length (Figure 4D) and (B) clinoform spacing (Figure 4D) generated from published seismic data from the Sognefjord Formation (figures 3, 12 in Dreyer et al., 2005). Gray bars represent the values for clinoform length and spacing drawn at random from the normal distribution and used to populate the Troll sector model.