The AAPG/Datapages Combined Publications Database
AAPG Bulletin
Figure
AAPG Bulletin; Year: 2015; Issue: June DOI: 10.1306/01191513191
Return to Full Text

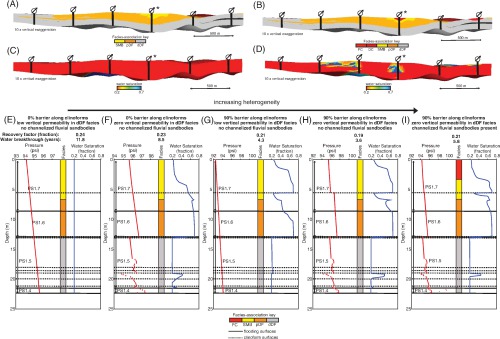
Figure 15
(A, B) Cross sections of facies-association belts along the structural crest of two models containing multiple, stacked delta-lobe deposits (with the coastal-plain deposits shown in Figure 3E removed), showing the location of production wells: (A) 0% barrier to flow along clinoforms, non-zero vertical permeability ( of 7 md) in distal delta-front heteroliths (dDF) deposits, and no channelized fluvial sandbodies (FC); and (B) 90% barrier to flow along clinoforms, zero vertical permeability in dDF deposits, and FC sandbodies present. Pressure and water-saturation profiles along the labeled well in both models are shown in parts E–I. (C, D) Corresponding cross sections showing water saturation after 10 yr of production with a target oil production rate over 10 yr of
  (2200 bbl/day). (E–I) Facies-association successions, stratigraphic surfaces, and pressure and water-saturation profiles after 10 yr of production along production well (labeled with asterisk in parts A–D), with dashed lines denoting clinoforms and black lines representing parasequence bounding flooding surfaces. Well data extracted from five models are shown, with increasing heterogeneity from left to right: (E) 0% barrier to flow along clinoforms, non-zero vertical permeability (
 of 7 md) in dDF deposits, and no FC sandbodies; (F) 0% barrier to flow along clinoforms, zero vertical permeability in dDF deposits, and no FC sandbodies; (G) 90% barrier to flow along clinoforms, non-zero vertical permeability (
 of 7 md) in dDF deposits, and no FC sandbodies; (H) 90% barrier to flow along clinoforms, zero vertical permeability in dDF deposits, and no FC sandbodies; and (I) 90% barrier to flow along clinoforms, zero vertical permeability in dDF deposits, and FC sandbodies present. SMB = stream-mouth-bar sandstones; pDF = proximal delta-front sandstones.

Figure 15
(A, B) Cross sections of facies-association belts along the structural crest of two models containing multiple, stacked delta-lobe deposits (with the coastal-plain deposits shown in Figure 3E removed), showing the location of production wells: (A) 0% barrier to flow along clinoforms, non-zero vertical permeability ( of 7 md) in distal delta-front heteroliths (dDF) deposits, and no channelized fluvial sandbodies (FC); and (B) 90% barrier to flow along clinoforms, zero vertical permeability in dDF deposits, and FC sandbodies present. Pressure and water-saturation profiles along the labeled well in both models are shown in parts E–I. (C, D) Corresponding cross sections showing water saturation after 10 yr of production with a target oil production rate over 10 yr of
(2200 bbl/day). (E–I) Facies-association successions, stratigraphic surfaces, and pressure and water-saturation profiles after 10 yr of production along production well (labeled with asterisk in parts A–D), with dashed lines denoting clinoforms and black lines representing parasequence bounding flooding surfaces. Well data extracted from five models are shown, with increasing heterogeneity from left to right: (E) 0% barrier to flow along clinoforms, non-zero vertical permeability (
of 7 md) in dDF deposits, and no FC sandbodies; (F) 0% barrier to flow along clinoforms, zero vertical permeability in dDF deposits, and no FC sandbodies; (G) 90% barrier to flow along clinoforms, non-zero vertical permeability (
of 7 md) in dDF deposits, and no FC sandbodies; (H) 90% barrier to flow along clinoforms, zero vertical permeability in dDF deposits, and no FC sandbodies; and (I) 90% barrier to flow along clinoforms, zero vertical permeability in dDF deposits, and FC sandbodies present. SMB = stream-mouth-bar sandstones; pDF = proximal delta-front sandstones.