The AAPG/Datapages Combined Publications Database
AAPG Bulletin
Full Text
![]() Click to view page images in PDF format.
Click to view page images in PDF format.
AAPG Bulletin, V.
 2015. The American Association of Petroleum Geologists. All rights reserved. Gold Open Access. This paper is published under the terms of the CC-BY license.
DOI: 10.1306/01191513191
Three-dimensional modeling of clinoforms in shallow-marine reservoirs: Part 2. Impact on fluid flow and hydrocarbon recovery in fluvial-dominated deltaic reservoirs
Gavin H. Graham,1 Matthew D. Jackson,2 and Gary J. Hampson3
1Department of Earth Science and Engineering, Imperial College London, South Kensington Campus, London SW7 2AZ, UK; present address: Geoscience Research Centre, TOTAL E&P UK, Crawpeel Road, Altens Industrial Estate, Aberdeen AB12 3FG, UK; [email protected]
2Department of Earth Science and Engineering, Imperial College London, South Kensington Campus, London SW7 2AZ, UK; [email protected]
3Department of Earth Science and Engineering, Imperial College London, South Kensington Campus, London SW7 2AZ, UK; [email protected]
ABSTRACT
Permeability contrasts associated with clinoforms have been identified as an important control on fluid flow and hydrocarbon recovery in fluvial-dominated deltaic parasequences. However, they are typically neglected in subsurface reservoir models or considered in isolation in reservoir simulation experiments because clinoforms are difficult to capture using current modeling tools. A suite of three-dimensional reservoir models constructed with a novel, stochastic, surface-based clinoform-modeling algorithm and outcrop analog data (Upper Cretaceous Ferron Sandstone Member, Utah) have been used here to quantify the impact of clinoforms on fluid flow in the context of (1) uncertainties in reservoir characterization, such as the presence of channelized fluvial sandbodies and the impact of bed-scale heterogeneity on vertical permeability, and (2) reservoir engineering decisions, including oil production rate.
The proportion and distribution of barriers to flow along clinoforms exert the greatest influence on hydrocarbon recovery; equivalent models that neglect these barriers overpredict recovery by up to 35%. Continuity of channelized sandbodies that cut across clinoform tops and vertical permeability within distal delta-front facies influence sweep within clinothems bounded by barriers. Sweep efficiency is reduced when producing at higher rates over shorter periods, because oil is bypassed at the toe of each clinothem. Clinoforms are difficult to detect using production data, but our results indicate that they significantly influence hydrocarbon recovery and their impact is typically larger than that of other geologic heterogeneities regardless of reservoir engineering decisions. Clinoforms should therefore be included in models of fluvial-dominated deltaic reservoirs to accurately predict hydrocarbon recovery and drainage patterns.
INTRODUCTION
Fluvial-dominated deltaic reservoirs commonly exhibit pressure compartmentalization, poor sweep efficiency, early water breakthrough, and lower than expected ultimate recovery of hydrocarbons (e.g., Begg et al., 1992; Tye et al., 1999). These reservoirs consist of multiple stacked delta lobes, juxtaposed with coastal-plain and channel-fill deposits. Within individual delta lobes, heterogeneity along inclined clinoforms in delta-front deposits can create tortuous flow pathways and variable sandbody connectivity (Ainsworth et al., 1999) and may contribute to these production characteristics. Clinoforms are formed by the progradation of delta or shoreface systems (Barrell, 1912; Rich, 1951; Gani and Bhattacharya, 2005), are typically below seismic resolution, and can be difficult to correlate between wells (e.g., Ainsworth et al., 1999; Hampson, 2000). This can make their characterization in both static (geologic) and dynamic (fluid-flow simulation) reservoir models difficult, such that clinoforms are typically omitted in models of shallow-marine reservoirs (Howell et al., 2008a).
Several studies have indicated it is important to include barriers to flow associated with clinoforms in reservoir models to accurately predict hydrocarbon recovery and drainage patterns in fluvial-dominated deltaic reservoirs. However, most studies investigated the effects of heterogeneity along clinoforms using either two-dimensional (2-D) models (e.g., White and Barton, 1999), which overestimate the impact of permeability contrasts along clinoforms because they are assumed to be continuous in the third dimension (Jackson and Muggeridge, 2000), or three-dimensional (3-D) models of volumes much smaller than most reservoirs (Forster et al., 2004; Mattson and Chan, 2004; Enge and Howell, 2010). Deveugle et al. (2011) created a reservoir-scale, 3-D model of multiple stacked delta-lobe deposits in an outcrop analog and found that sweep efficiency in stacked delta-lobe deposits is controlled by the orientation, continuity, and permeability of channelized sandbodies and by the vertical permeability of laterally extensive heterolithic distal delta-front deposits that form the lower part of each lobe. However, their models did not include clinoform surfaces. Other 3-D reservoir-scale models that incorporate clinoforms in fluvial-dominated deltaic strata have been reported, but these contained a limited number of clinoforms with a simplified planar geometry (Howell et al., 2008a, b). Consequently, the impact of clinoforms and their effect on fluid flow and hydrocarbon recovery in reservoir-scale models of fluvial-dominated deltaic reservoirs is still poorly understood, because no models have yet been developed that incorporate several stacked delta-lobe deposits, each of which contains multiple, geometrically realistic clinoforms.
The aim of this paper is to quantify the impact of uncertainty in clinoform distribution and clinoform-related heterogeneity on fluid flow during hydrocarbon recovery from multiple, stacked, fluvial-dominated delta-lobe deposits in the context of (1) uncertainties in reservoir characterization, including the orientation and continuity of stacked delta-front parasequences, and associated channelized sandbodies and the impact of bed-scale heterogeneity on vertical permeability; and (2) reservoir engineering decisions, including oil production rate. The clinoform-modeling algorithm demonstrated in a companion article (Graham et al., 2015, this volume) is used to incorporate multiple clinoform surfaces into a suite of reservoir-scale, surface-based 3-D geologic models containing several stacked delta lobes of varying azimuthal orientation. The models are based on data and an existing, high-resolution outcrop model from an outcrop analog, the Ferron Sandstone Member, central Utah (Deveugle et al., 2011), and serve as a case study for fluvial-dominated reservoirs.
We focus on the impact of five key parameters: (1) continuity of channelized fluvial (FC) sandbodies; (2) bed-scale heterogeneity in distal delta-front facies; (3) distribution of laterally extensive barriers to flow along clinoforms; (4) permeability of FC sandbodies; and (5) oil production rate. Model results are compared using dynamic measures of sweep through the reservoir volume (e.g., recovery factor, water breakthrough) and pressure and saturation measurements in the modeled production wells as a proxy for the reservoir-monitoring techniques that are widely applied to diagnose heterogeneity during production.
GEOLOGIC HETEROGENEITY IN FLUVIAL-DOMINATED DELTAIC RESERVOIRS
As the first part of our analysis, a hierarchy of stratigraphic and sedimentologic heterogeneity in fluvial-dominated deltaic reservoirs (modified after the more generic scheme for shallow-marine reservoirs of Kjønsvik et al., 1994) is presented, which provides a framework to identify, organize, and model the heterogeneities observed. The hierarchy classifies six lengthscales of heterogeneity, from the field scale (~10 km [6 mi]) to the pore scale (~10 μm) (Van de Graaf and Ealey, 1989), and places clinoforms observed in delta lobes (sensu Wellner et al., 2005; Bhattacharya, 2006) in their appropriate context.
The largest lengthscale is represented by a basinward-thinning wedge of strata that records the overall advance and retreat of a delta system (“genetic sequence” sensu Galloway, 1989) (Figure 1A). The wedge can be subdivided into several vertically stacked, shallow-marine tongues that interfinger with coeval offshore shales in a paleoseaward direction and with coeval coastal-plain deposits in a paleolandward direction. The stacking of successive shallow-marine tongues defines progradation followed by aggradation and then retrogradation. The top of each shallow-marine tongue and their associated coastal-plain deposits are locally eroded by channelized sandbodies of different types (e.g., deltaic distributary channel fills, fluvial channel fills, incised valley fills). Wedges are most likely formed by changes in tectonic subsidence (e.g., Galloway, 1989; Van Wagoner et al., 1990), although long-term autogenic processes internal to the source-to-sink delta system cannot be discounted (“autoretreat” sensu Muto and Steel, 1992; Muto et al., 2007). The development and stacking of shallow-marine tongues within a deltaic wedge is generally attributed to relative sea-level, including compactional subsidence, and sediment supply (e.g., Galloway, 1989; Van Wagoner et al., 1990).
 Figure 1
Generic hierarchy of heterogeneities within fluvial-dominated deltaic reservoirs across a range of lengthscales. Plan-view maps with corresponding cross sections oriented along depositional dip are shown for three orders of stratigraphic cycle: (A) vertically stacked shallow-marine tongues within a basinward-thinning wedge; (B) an individual shallow-marine tongue comprising compensationally stacked delta-lobe deposits; and (C) an individual delta-lobe deposit, showing selected clinoforms, which are marked by interfingering of facies-association belts. DC = distributary channel sandstones; SMB = stream-mouth-bar sandstones; pDF = proximal delta-front sandstones; dDF = distal delta-front heteroliths; PD = prodelta shales. Sedimentologic heterogeneity at smaller lengthscales is shown for (D) an upward-thickening succession of sediment gravity-flow sandstone beds bounded by clinoforms within the dDF facies-association belt; (E) the internal structure of an individual sediment gravity-flow sandstone bed; and (F) the microscopic lamination.
Figure 1
Generic hierarchy of heterogeneities within fluvial-dominated deltaic reservoirs across a range of lengthscales. Plan-view maps with corresponding cross sections oriented along depositional dip are shown for three orders of stratigraphic cycle: (A) vertically stacked shallow-marine tongues within a basinward-thinning wedge; (B) an individual shallow-marine tongue comprising compensationally stacked delta-lobe deposits; and (C) an individual delta-lobe deposit, showing selected clinoforms, which are marked by interfingering of facies-association belts. DC = distributary channel sandstones; SMB = stream-mouth-bar sandstones; pDF = proximal delta-front sandstones; dDF = distal delta-front heteroliths; PD = prodelta shales. Sedimentologic heterogeneity at smaller lengthscales is shown for (D) an upward-thickening succession of sediment gravity-flow sandstone beds bounded by clinoforms within the dDF facies-association belt; (E) the internal structure of an individual sediment gravity-flow sandstone bed; and (F) the microscopic lamination.
Shallow-marine tongues can be further subdivided into multiple, smaller stratigraphic units that are broadly equivalent to delta lobes (Figure 1B). Each delta-lobe deposit was fed by a trunk deltaic distributary channel that branched downstream (cf. Roberts et al., 2004, p. 185). Nodal avulsion of the trunk distributary channel controls the lateral switching of lobes, which are stacked in a compensational pattern within each shallow-marine tongue (each tongue thus constitutes a “delta complex” sensu Frazier, 1967) (Figure 1B). This stacking is at least partly autogenic and reflects internal geomorphic thresholds and morphodynamic responses within the delta system (Frazier, 1967; Coleman, 1988; Hoyal and Sheets, 2009). The application of sequence stratigraphic terminology to shallow-marine tongues and their constituent delta-lobe deposits has been ambiguous in the Ferron Sandstone Member and likely also in other deltaic strata. Shallow-marine tongues have been interpreted as either parasequences (e.g., Anderson and Ryer, 2004) or as parasequence sets in which their constituent delta-lobe deposits represent parasequences (e.g., Garrison and Van den Bergh, 2004; Deveugle et al., 2011). Here we follow the latter nomenclature, with each shallow-marine tongue assigned to a parasequence set and each delta-lobe deposit to a parasequence.
Within a single delta-lobe deposit, there is a proximal-to-distal trend in facies associations from a trunk distributary channel sandstone (DC facies association), which branches downstream into terminal distributaries that are contiguous with assemblages of stream-mouth-bar sandstones (SMB) (Olariu and Bhattacharya, 2006), which in turn pass successively down dip into proximal delta-front sandstones (pDF), distal delta-front heteroliths (dDF), and prodelta mudstones (PD) (e.g., Wellner et al., 2005) (Figure 1C). Clinoforms control aspects of detailed facies architecture at this lengthscale, such as interfingering of facies-association belts (Ainsworth et al., 1999; Dutton et al., 2000; Howell et al., 2008a, b; Enge and Howell, 2010), and are also present as bed boundaries at smaller scales (e.g., within facies-association belts, Figure 1D) (e.g., Gani and Bhattacharya, 2005, 2007; Enge et al., 2010). Each facies-association belt exhibits variations in bed geometry, thickness, and stacking. For example, the dDF facies-association belt consists of sharp or erosionally based sandstone beds alternating with mudstones. These heterolithic deposits are arranged into successions in which sandstone beds thicken and become more abundant upward and that are bounded by clinoforms; these successions constitute clinothems (sensu Rich, 1951) or bedsets (e.g., Howell et al., 2008b; Enge and Howell, 2010). Many sandstone beds in the dDF facies-association belt contain a vertical succession that records deposition from a waning, unidirectional sediment gravity flow, such as a turbidity current or hyperpycnal flow (e.g., Newman and Chan, 1991; Mulder et al., 2003; Olariu et al., 2010). Sandstone beds generally form sheets that thin gradually in a paleoseaward direction, but they may be amalgamated as a result of localized erosion at their bases (e.g., Ryer and Anderson, 2004; Olariu et al., 2010). Interfingering of facies-association belts and the variable bed-scale successions within the belts reflect a variety of controls, including spatial and temporal (seasonal-to-millennial) variations in sediment and water discharge via the distributary channels (e.g., Olariu et al., 2010), and interaction of the delta front with basinal processes such as waves, storms, and tides (e.g., Gani and Bhattacharya, 2007). Smaller-scale heterogeneities include sedimentary structures and the degree and type of bioturbation present within beds (Figure 1E), as well as grain size and sorting characteristics, which control pore geometries at the microscopic scale (Figure 1F).
GEOLOGIC HETEROGENEITY INVESTIGATED IN THIS STUDY
The hierarchy described for fluvial-dominated deltaic reservoirs (Figure 1) is used as a framework to select the heterogeneities investigated here in flow simulation experiments. We are particularly interested in capturing heterogeneity at the lengthscales within individual delta-lobe deposits (i.e., intraparasequence scale) in models that comprise multiple, stacked, delta-lobe deposits (Figure 1B, C). Consequently, the models explicitly capture multiple clinoform surfaces and associated barriers, facies-association boundaries within delta-lobe parasequences, and the geometry and distribution of channelized sandbodies that truncate the top of delta-lobe parasequences. The parameters used to describe these heterogeneities and the range of values assigned to these parameters are taken largely from a well-documented outcrop analog, the Ferron Sandstone Member of east-central Utah (Figure 2). Four key parameters are investigated; the character of each parameter is likely to be uncertain in the subsurface (summarized in Table 1).
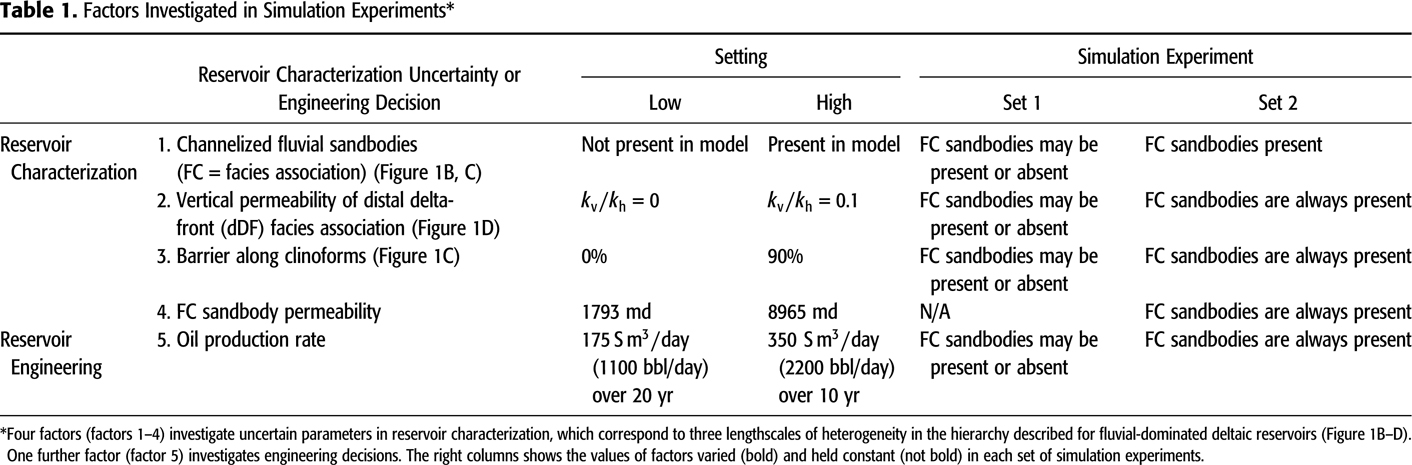
 Figure 2
(A) Paleogeographic reconstruction of the late Cretaceous Last Chance and Vernal delta systems of the Ferron Sandstone Member of the Mancos Shale in present-day Utah (after Cotter, 1976 and used with permission of Brigham Young University). The location of a regional cross section, shown in (B), is highlighted, and the locations of the plan-view facies-association maps in Figure 3A–E are shown. (B) Detailed regional cross section through the lowermost shallow-marine tongue of the Last Chance delta system of the Ferron Sandstone Member (parasequence set 1 of Deveugle et al., 2011) (after Garrison and Van den Bergh, 2004 and used with permission of AAPG). Four delta-lobe deposits (parasequences 1.4, 1.5, 1.6, and 1.7 of Deveugle et al., 2011) are modeled in this study.
Figure 2
(A) Paleogeographic reconstruction of the late Cretaceous Last Chance and Vernal delta systems of the Ferron Sandstone Member of the Mancos Shale in present-day Utah (after Cotter, 1976 and used with permission of Brigham Young University). The location of a regional cross section, shown in (B), is highlighted, and the locations of the plan-view facies-association maps in Figure 3A–E are shown. (B) Detailed regional cross section through the lowermost shallow-marine tongue of the Last Chance delta system of the Ferron Sandstone Member (parasequence set 1 of Deveugle et al., 2011) (after Garrison and Van den Bergh, 2004 and used with permission of AAPG). Four delta-lobe deposits (parasequences 1.4, 1.5, 1.6, and 1.7 of Deveugle et al., 2011) are modeled in this study.
Presence of Channelized Fluvial Sandbodies
There is uncertainty in the interpretation that FC sandbodies (FC facies association) are present in the model area (Figure 3E) and cut into genetically unrelated, stacked delta-lobe deposits from a higher stratigraphic interval (Figure 3A–D). The presence of FC sandbodies is inferred from regional mapping outside the study area, where the basal contact of the coastal plain interval is interpreted as a sequence boundary marked by channelized sandbodies (Deveugle et al., 2011). The presence of FC sandbodies in subsurface fluvial-dominated deltaic reservoirs is subject to similar uncertainties in interpretation (e.g., Tye, 2004).
 Figure 3
(A–E) Distribution of facies-association belts at the top of parasequences 1.4, 1.5, 1.6, and 1.7 and in the overlying coastal-plain interval (after Deveugle et al., 2011), with the area of the models described in this paper shown by dashed lines. The regional paleogeographic and stratigraphic context of the maps is illustrated in Figure 2. CP = coastal plain deposits; FC = channelized fluvial sandbodies; DC = distributary channel sandstones; SMB = stream-mouth-bar sandstones; pDF = proximal delta-front sandstones; dDF = distal delta-front heteroliths; PD = prodelta shales.
Figure 3
(A–E) Distribution of facies-association belts at the top of parasequences 1.4, 1.5, 1.6, and 1.7 and in the overlying coastal-plain interval (after Deveugle et al., 2011), with the area of the models described in this paper shown by dashed lines. The regional paleogeographic and stratigraphic context of the maps is illustrated in Figure 2. CP = coastal plain deposits; FC = channelized fluvial sandbodies; DC = distributary channel sandstones; SMB = stream-mouth-bar sandstones; pDF = proximal delta-front sandstones; dDF = distal delta-front heteroliths; PD = prodelta shales.
However, even if channels are interpreted to be present in the model area, there is still considerable uncertainty in how the FC sandbodies are represented in reservoir models (e.g., Howell et al., 2008a). These sandbodies were populated in the model of Deveugle et al. (2011) using a single, stochastic, object-based modeling realization constrained by published data on sandbody dimensions (Reynolds, 1999; Tye, 2004). However, if further stochastic realizations of the model were generated, the position, geometry, and orientation of the channelized sandbodies would change with each realization, such that FC sandbodies may not be present in the study area (Figure 3E). Modeling such sandbodies in subsurface fluvial-dominated deltaic reservoirs is also subject to similar uncertainty. Uncertainties in interpretation and modeling strategies are considered by using two settings in the models presented herein, with FC sandbodies either present (i.e., taken from the model of Deveugle et al., 2011) or absent (Table 1).
Permeability Anisotropy in Distal Delta-Front Heteroliths
Distal delta-front heteroliths consist of sharp or erosionally based sandstone beds alternating with mudstones (Figure 1D). Sandstone beds generally form sheets that thin gradually in a paleoseaward direction, but they may be amalgamated as a result of localized erosion at their bases (e.g., Ryer and Anderson, 2004; Olariu et al., 2010). Where mudstone beds are laterally extensive, effective vertical permeability approaches zero. The spatial distribution of erosion at the base of sandstone beds is poorly understood but, where present, increases connectivity between sandstone beds that are otherwise isolated, thus increasing the effective vertical permeability (Haldorsen and Lake, 1984; Begg and Chang, 1985; Begg and King, 1985). We consider both scenarios by applying  ratios (
 permeability;
  permeability) of 0 and 0.1 to distal delta-front deposits in our simulation experiments (Table 1).
Barrier Coverage along Clinoforms
Heterogeneity along clinoforms is subject to considerable uncertainty in characterization using both outcrop and subsurface data sets, such that the proportion of each clinoform that acts as a barrier to flow is poorly documented, even in well-studied outcrop analogs (Howell et al., 2008a; Enge and Howell, 2010). In models of stacked delta-lobe parasequences, we investigate end-member scenarios in which heterogeneity along clinoforms is either absent (0% barrier coverage along clinoforms) or extensive (90% barrier coverage along clinoforms) (Table 1).
Permeability of Channelized Sandbodies
Deveugle et al. (2011) noted that DC facies association are genetically related to the delta-lobe deposits at their down-dip terminations and hence inferred that they share similar sediment-textural characteristics and petrophysical properties with the SMB facies association in the proximal parts of delta lobes (Figure 1C). In contrast, FC-fill sandstones (FC facies association) (Figure 3E) are genetically unrelated to underlying delta-lobe deposits and may have markedly differing sediment-textural characteristics and petrophysical properties. The approach of Deveugle et al. (2011) is followed in investigating the impact of such sediment-textural characteristics as grain size on flow (Figure 1E) by varying the permeability of FC sandbodies. Two scenarios are investigated, in which permeabilities in FC sandbodies remain the same as DC and SMB sandstones or are five times larger (Table 1).
DESIGN OF SIMULATION EXPERIMENTS
An experimental design approach and analysis of variance is used, which allows the relative effects of different variables to be quantified while minimizing the number of simulation experiments (Box and Draper 1987; Willis and White, 2000). Two sets of simulation experiments were carried out using the reservoir-scale models of several, stacked delta-lobe deposits to quantify the impact of four geologic heterogeneities (factors 1–4 in Table 1) and one engineering decision (factor 5 in Table 1) on recovery. In the first set of simulation experiments, FC sandbodies may be present or absent (Table 1), whereas in the second set, FC sandbodies of varying permeability are always present (Table 1). A two-level fractional–factorial design was used in both sets of simulation experiments, with each of the studied factors varied between two end-member settings (Table 1). Additional sensitivity tests were carried out on models of a single delta-lobe deposit to further investigate the impact of selected heterogeneities highlighted by the suite of experimental design results. The results of these sensitivity tests and associated insights are reported in the discussion of the experimental design results.
PRODUCTION STRATEGY
Production is simulated using a line-drive waterflood development with four vertical injection wells and six vertical production wells spaced 750 m (2461 ft) apart (Figure 4). All wells are completed over the whole reservoir interval in each model. Two scenarios are used to investigate the impact on sweep efficiency of producing at a higher rate over a shorter time period, with oil production and water injection for the groups of production and injection wells set to maintain a target production rate over 10 yr of  (2200 bbl/day) and over 20 yr of
  (1100 bbl/day) (Table 1). In both production scenarios, there is a minimum bottomhole pressure (BHP) constraint of 50 bar (725 psi) for each production well and a maximum BHP constraint of 150 bar (2175 psi) for each injection well.
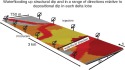 Figure 4
Three-dimensional perspective view showing the simulated production scheme used in the models of several stacked delta-lobe deposits (parasequences 1.4–1.7 and overlying coastal-plain deposits of Deveugle et al., 2011; Figure 3A–E), illustrated using maps of facies-association belts at the top of the model volumes. A structural dip of 8° is applied to all models, which results in simulated waterflooding in a range of directions relative to the local depositional dip (i.e., azimuthal orientation) of each delta-lobe parasequence (Figure 3A–E). In all models, production is simulated using a line drive of four injection wells located down structural dip of six production wells. Facies associations are colored according to the key in Figure 3.
Figure 4
Three-dimensional perspective view showing the simulated production scheme used in the models of several stacked delta-lobe deposits (parasequences 1.4–1.7 and overlying coastal-plain deposits of Deveugle et al., 2011; Figure 3A–E), illustrated using maps of facies-association belts at the top of the model volumes. A structural dip of 8° is applied to all models, which results in simulated waterflooding in a range of directions relative to the local depositional dip (i.e., azimuthal orientation) of each delta-lobe parasequence (Figure 3A–E). In all models, production is simulated using a line drive of four injection wells located down structural dip of six production wells. Facies associations are colored according to the key in Figure 3.
MODEL CONSTRUCTION
A surface-based approach to model construction (Sech et al., 2009; Jackson et al., 2014) was followed, in which surfaces are used to represent both key stratigraphic surfaces and facies boundaries. Surfaces are modeled before the grid is defined, so model geometry is not limited by grid resolution (Jackson et al., 2009). The geometry of the grid is driven by the geometry of the modeled surfaces; we simulate fluid flow directly on these grids without upscaling, thus allowing the complex spatial geometries in the model to be preserved during flow simulation.
Geologic Framework for Clinoform-Bearing Models of the Ferron Sandstone Outcrop Analog
Four delta-lobe deposits within the lowermost sandstone tongue of the Ferron Sandstone Member (parasequences 1.4, 1.5, 1.6, and 1.7 of Deveugle et al., 2011) and thin (<10 m [33 ft]) overlying coastal-plain deposits (CP facies association) in the Ivie Creek study area (Figures 3A–E, 4) are the focus of the work reported herein. Each delta-lobe deposit exhibits a subtle change in plan-view aspect ratio (width-to-length) and azimuthal orientation (Figure 3A–D) (see also Figure 11 in Deveugle et al., 2011). Surfaces representing parasequence-bounding flooding surfaces and facies-association boundaries are extracted from the model of Deveugle et al. (2011) over a model area of  (
( ) (Figure 3). There are no faults within the model volume. In the model of stacked delta-lobe deposits (Figure 5), the surface representing the top of the coastal-plain deposits (approximating the sub-A coal seam; Anderson and Ryer, 2004) was adjusted so that it is horizontal over the model area and used as a reference surface from which the vertical positions of all other flooding surfaces and facies-association boundaries were reconstructed via isochores. This reference layer is chosen because it is underlain by the sub-A coal seam, implying that it was essentially paleohorizontal (Deveugle et al., 2011). The parasequence-bounding flooding surfaces at the top and base of each delta-lobe deposit define the rock volume within which clinoform surfaces are to be modeled and are used as an input for the clinoform-modeling algorithm (Graham et al., 2015, this volume). In a subsequent step, described later in the “Modeling Reservoir Structure” section, a uniform structural dip was applied to the model.
 Figure 5
(A, D) Distribution of facies-association belts at the top of fluvial-dominated deltaic deposits (parasequence 1.7) in models of stacked delta-lobe parasequences, and associated model cross-sections illustrating facies architecture along (B, E) regional depositional dip and (C, F) regional depositional strike. Two models are shown, either (A–C) lacking or (D–F) containing channelized fluvial sandbodies that truncate the underlying delta-lobe parasequences. Facies associations are colored according to the key in Figure 3.
Figure 5
(A, D) Distribution of facies-association belts at the top of fluvial-dominated deltaic deposits (parasequence 1.7) in models of stacked delta-lobe parasequences, and associated model cross-sections illustrating facies architecture along (B, E) regional depositional dip and (C, F) regional depositional strike. Two models are shown, either (A–C) lacking or (D–F) containing channelized fluvial sandbodies that truncate the underlying delta-lobe parasequences. Facies associations are colored according to the key in Figure 3.
Modeling the Geometry and Distribution of Clinoform Surfaces
The clinoform-modeling algorithm of Graham et al. (2015, this volume) allows the user to specify the plan-view and cross-sectional geometries, distribution, and progradation direction of clinoforms within a delta-lobe deposit. Its application to modeling clinoforms in multiple, stacked delta-lobe deposits is outlined briefly below (for a fuller description of its application, see Graham et al., 2015, this volume). The plan-view aspect ratio and azimuthal orientation of each delta-lobe deposit was taken from Deveugle et al. (2011, their Figure 11).
Geometric data describing the distribution, cross-sectional shape, and length of clinoforms in depositional dip cross-section were extracted from bedding-diagram interpretations of Forster et al. (2004), clinoform length and dip statistics of Enge et al. (2010), and the light detection and ranging (LIDAR) data used to create the model of Enge and Howell (2010) (Table 2). For delta-lobe deposits in which only one or two distal facies associations are present in the model volume (parasequences 1.4 and 1.5, Figure 3A, B), data describing clinoform geometry in each facies-association type were extracted from the area where outcrop data are available, and these values were used as inputs for applying the clinoform-modeling algorithm (Table 2). The clinoform-modeling algorithm was used to deterministically model clinoform surfaces in the area where outcrop data are available and to stochastically populate clinoform surfaces elsewhere in the model volume. For simplicity, clinoforms are distributed in each delta-lobe deposit with (in the first instance) a uniform spacing of 100 m (328 ft) (e.g., Figure 5), where clinoform spacing is defined as the horizontal distance between the top-truncation points of two successive clinoforms (Table 1 of Graham et al., 2015, this volume). Not every clinoform observed at outcrop is explicitly represented as a surface in the models; instead, the aim here is to capture clinoforms bounding upward-thickening successions of sandstone beds (“mouth-bar assemblages,” sensu Bhattacharya, 2006; “bedsets,” sensu Enge et al., 2010) (e.g., Figure 1C, D). The chosen spacing is consistent with seismic imaging of clinoforms in shallow-marine reservoirs (e.g., Holgate et al., 2014) and with available computing resources. Later in this paper, we investigate the impact of decreased clinoform spacing of 50 and 25 m (164 and 82 ft).
Heterogeneities at smaller lengthscales are modeled implicitly through the petrophysical properties assigned to grid blocks of a particular facies association (e.g., Jackson et al., 2009; Deveugle et al., 2011; Graham et al., 2015, this volume). Although each delta-lobe deposit is interpreted to contain a dense, downstream-branching network of distributary channels (e.g., Wellner et al., 2005; Olariu and Bhattacharya, 2006; cf. Figure 1B), such deposits are only sampled in one parasequence in the model volume (Figure 3D) and lie outside of the study area in the other parasequences (Figure 3A–C, E) Deveugle et al., 2011). Distributary-channel deposits are represented as an erosionally based, downstream-thinning and downstream-widening zone lacking clinoforms in the innermost part of this delta-lobe deposit (e.g., Figure 5). The uppermost delta-lobe parasequence (parasequence 1.7) is locally truncated by FC sandbodies in some models (Figure 5D–F). The facies-association boundary surfaces extracted from the model of Deveugle et al. (2011) are then used in combination with the clinoform surfaces and parasequence-bounding flooding surfaces to create facies-association zones within each clinothem (i.e., between each pair of clinoforms). Each facies-association zone is gridded separately, such that the grid conforms to the architecture of the flooding surfaces, clinoform surfaces, and facies-association boundaries. Because the facies boundary surfaces were extracted from a model that omitted clinoforms and are laterally continuous over the model volume (Deveugle et al., 2011), the potential impact of facies interfingering has not been captured here. The resulting surface-based models contain up to 211 surfaces (5 flooding surfaces, 100 clinoform surfaces, and 106 facies-association boundaries) and capture the complex facies architectures and clinoform distributions within the parasequence set (Figure 5).
Modeling Heterogeneity along Clinoforms
Discontinuous, impermeable mudstones or concretionary cemented layers that form barriers along clinoforms are represented in the models using bodies that are elliptical in plan view (after the methodology of Jackson et al., 2009). There are few outcrop data sets that quantify the extent or geometry of such barriers along clinoforms (e.g., White and Willis, 2000; Lee et al., 2007; Eide et al., 2014; Hampson et al., 2014). Sensitivity tests indicate that ellipses are suitable objects to represent these barriers for modeling and flow simulation purposes, because they can be described using simple mathematical functions and their abundance and overlap control barrier coverage along clinoforms, provided ellipse dimensions are small relative to the area of the clinoform (Jackson et al., 2009). In this case, small ellipses (<150 m [492 ft] diameter) are stochastically placed along each clinoform surface using a frequency function that decreases the probability of ellipses being placed along the upper part of the clinoform (Figure 6B):
where  ,
,  , and
, and  are dimensionless constants (
 ,
,  ,
,  ) and
) and  is the normalized distance from the down-dip termination of the clinoform, given by
Here,  and
and  are the respective lengths of ellipses representing the base and top of a clinoform in plan view (Graham et al., 2015, this volume), and
  is a uniformly generated random number. In the absence of quantitative data, the constants in equation 1 are obtained through qualitative comparison of the function with previous studies of the Ferron Sandstone Member outcrops (Garrison and Van den Bergh, 2004; Howell et al., 2008b; Enge and Howell, 2010). This method defines the spatial distribution of barriers along a clinoform for a value of barrier coverage that is specified by the user (Figure 6C). In a final step, barrier coverage along the clinoform surface is translated into a grid property. The transmissibility of the cells in the grid layer above the clinoform surface is set to zero where a barrier is present and remains one where barriers are absent (Figure 6D), so the geometry of the heterogeneity is represented during flow simulation. To ensure that the barriers do not constitute a disproportionate fraction of the model volume, the transmissibility of cells was adjusted rather than explicitly assigning properties to the cells. We use this process to create models in which barrier coverage along the clinoforms ranges from 0% to 90%. Initially, we investigate the impact on flow of these two end-member barrier coverage values; later in the paper we quantify the impact of intermediate values.
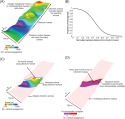 Figure 6
(A) Three-dimensional clinoform surface from parasequence 1.5 in the reservoir-scale model of the Ferron Sandstone Member (Figures 2B, 3B), generated using the clinoform-modeling algorithm of Graham et al. (2015, this volume). (B) The generic frequency function (equation 1) used to place elliptical barriers along each clinoform surface. Note the
Figure 6
(A) Three-dimensional clinoform surface from parasequence 1.5 in the reservoir-scale model of the Ferron Sandstone Member (Figures 2B, 3B), generated using the clinoform-modeling algorithm of Graham et al. (2015, this volume). (B) The generic frequency function (equation 1) used to place elliptical barriers along each clinoform surface. Note the  axis is dimensionless and has been scaled between 0 and 1 so the same function can be applied to clinoforms with varying lengths. (C) Extent of overlapping elliptical barriers along the 3-D clinoform surface in part A. The barriers cover 80% of the clinoform surface. (D) The barrier-covered clinoform surface in part C is translated into a transmissibility multiplier grid property in
  ,
,  , and/or
  directions, depending on the orientation of the clinoform. The transmissibility multiplier is modified for cells in the grid layer above the clinoform surface. Grid cells in red are assigned a transmissibility multiplier of 1 and are open to flow, whereas grid cells in purple are assigned a transmissibility multiplier of 0 and act as a barrier to flow.
Modeling Reservoir Structure
The structural configuration of the reservoir influences well placement, such that water is injected up structural dip to production wells, and the density contrast between oil and water helps to stabilize the displacement front. The relationship between structural dip and waterflood direction can also strongly modify the effect of depositional clinoform dip on sweep (Wehr and Brasher, 1996; Howell et al., 2008b; Jackson et al., 2009). The methodology of Jackson et al. (2009) was applied to adjust the vertical coordinates of the grid cells in every grid layer to impose a uniform structural dip of 8° that is representative of fluvial-dominated deltaic reservoirs in the Prudhoe Bay (Alaska) field (e.g., Begg et al., 1992) and shallow-marine reservoirs within tilted fault blocks in the North Sea (e.g., Tollas and McKinney, 1991; Wehr and Brasher, 1996; Husmo et al., 2003). For the model of stacked delta-lobe deposits, waterflooding is simulated up structural dip (Figure 4), but each of the delta-lobe deposits in the model has a different azimuthal orientation relative to the waterflood direction, such that some are aligned along depositional dip (Figure 3A, D) and others along depositional strike (Figure 3B, C).
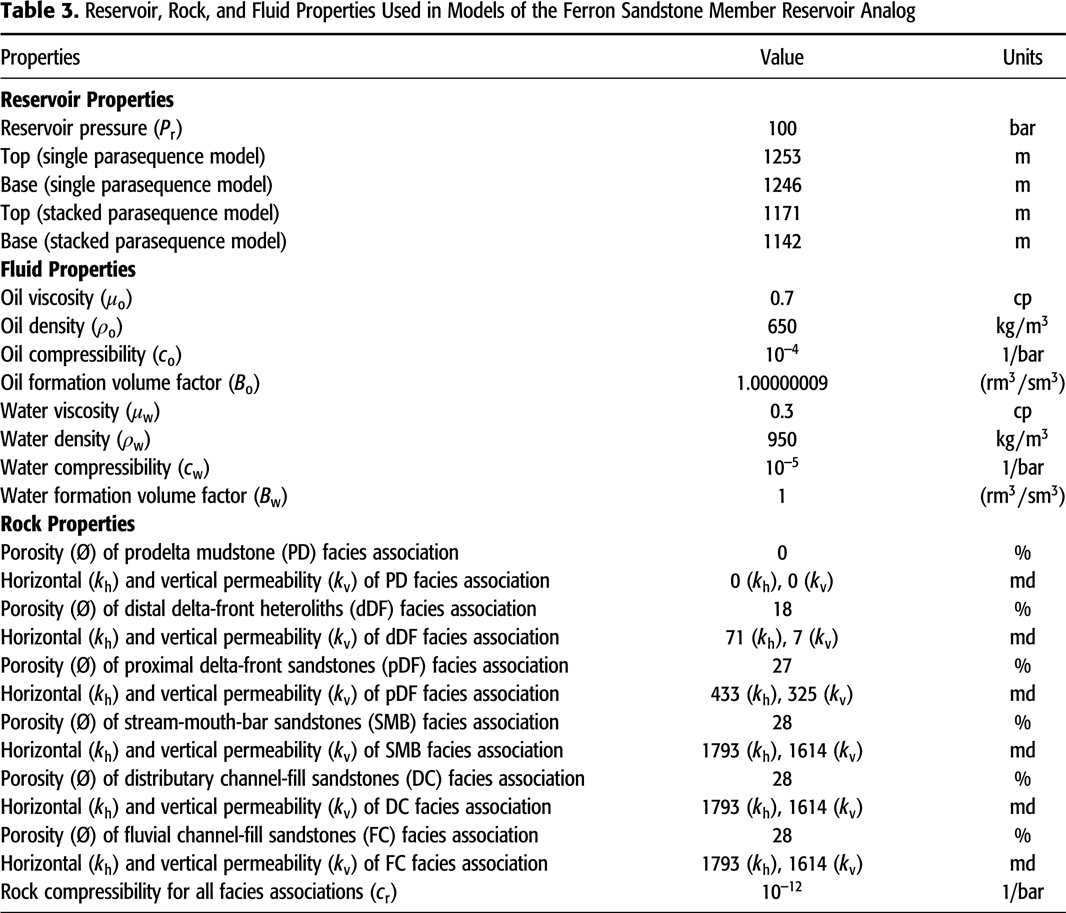
Rock and Fluid Properties
In the final step before fluid flow simulation, petrophysical properties were assigned to each facies-association type using values from an analogous subsurface reservoir (table 1 of Deveugle et al., 2011). In all models, a single value of porosity and permeability was assigned to each facies association (Table 3). This approach was used because the boundaries between facies associations are typically marked by approximately order-of-magnitude contrasts in permeability that control sweep patterns. Although we recognize that petrophysical properties vary within facies-association types, we do not explicitly include these heterogeneities because they occur over lengthscales smaller than a single grid block in the models (Figure 1D–F). The same relative permeability data, which are typical of water-wet reservoirs in the North Sea (e.g., Anderson, 1987; Stiles and Hutfilz, 1992), were applied to each facies association. Capillary pressure curves are dependent on the facies-association type. These data, as well as oil and water properties, are similar to those documented in many North Sea Brent Group reservoirs and have been widely used in previous modeling studies of shallow-marine reservoirs (e.g., Kjønsvik et al., 1994; Matthews et al., 2008; Jackson et al., 2009).
RESULTS
We begin by considering the first set of simulation experiments, in which models of stacked delta-lobe deposits either contain or lack FC sandbodies (Table 1). The impact of geologic heterogeneities and/or engineering decisions on recovery factor and total water produced was quantified by calculating the average change in response from the mean when a factor is changed from setting one to setting two (Table 1). We then consider models of stacked delta-lobe deposits that always contain FC sandbodies in the second set of simulation experiments (Table 1). This approach allows quantification of the effect on recovery factor and total water produced by varying the rock properties of the FC facies association in the context of other reservoir characterization and engineering parameters.
Stacked Delta-Lobe Deposits with Channelized Fluvial Sandbodies Either Present or Absent
Simulated oil recovery after 10 or 20 yr of production at the target production rates (Table 1) ranges from 19% to 24% of the original oil in place. Recovery is dominated by production from SMB and pDF facies associations, and the variation in recovery is principally controlled by the presence or absence of laterally extensive barriers to flow along clinoforms (Figure 7A). Modeling clinoforms with a 90% barrier to flow along them decreases oil recovery by ∼5% (green bar in Figure 7A) and increases the total water produced in the models by ∼55% (blue bar in Figure 7A), which suggests that characterizing clinoforms in field-scale models of fluvial-dominated deltaic reservoirs is important to accurately predict water breakthrough and hydrocarbon recovery.
 Figure 7
Average percentage change in oil recovery (green bars) and total volume of water produced (blue bars) in models of stacked delta-lobe deposits, observed when each factor in the experimental design is varied from setting 1 to setting 2 (Table 1) for (A) models that either contain or lack channelized fluvial sandbodies (FC) (i.e., set 1 of simulation experiments in Table 1) and (B) models that contain FC sandbodies of varying permeability (i.e., set 2 of simulation experiments in Table 1). If the bars lie to the right, the change is positive and more oil is recovered or more water is produced. For example, if the models contain a 90% barrier to flow along clinoforms (setting 2), oil recovery decreases by ∼5% and increases the total water produced in the models by ∼55% compared with models containing clinoforms with 0% barrier coverage (setting 1). The effects of individual factors and combinations of factors are displayed, where these are considered significant (i.e., >0.5% change in recovery factor, >1% change in total water produced).
Figure 7
Average percentage change in oil recovery (green bars) and total volume of water produced (blue bars) in models of stacked delta-lobe deposits, observed when each factor in the experimental design is varied from setting 1 to setting 2 (Table 1) for (A) models that either contain or lack channelized fluvial sandbodies (FC) (i.e., set 1 of simulation experiments in Table 1) and (B) models that contain FC sandbodies of varying permeability (i.e., set 2 of simulation experiments in Table 1). If the bars lie to the right, the change is positive and more oil is recovered or more water is produced. For example, if the models contain a 90% barrier to flow along clinoforms (setting 2), oil recovery decreases by ∼5% and increases the total water produced in the models by ∼55% compared with models containing clinoforms with 0% barrier coverage (setting 1). The effects of individual factors and combinations of factors are displayed, where these are considered significant (i.e., >0.5% change in recovery factor, >1% change in total water produced).
When  in the dDF facies association, oil recovery is increased by ∼2% and total water produced is decreased by ∼44% (Figure 7A). If there is a barrier along 90% of each clinoform and
  in the dDF facies association, oil recovery is increased by ∼2%, but total water produced is increased by ∼34% (Figure 7A). This suggests that a greater volume of oil is displaced in the dDF facies association when vertical permeability is increased, but it does not have the same impact on sweep efficiency in the reservoir as the presence of FC sandbodies.
The presence of laterally continuous, FC sandbodies alone increases oil recovery by ∼2% and reduces the total water produced by ∼6% (Figure 7A). Furthermore, if clinoforms are present with a 90% barrier along them, then the presence of FC sandbodies can increase recovery by ∼2% and decrease total water production by ∼4% (Figure 7A), suggesting that their presence improves sweep efficiency in the reservoir.
Production rate has much less impact on oil recovery, with the average effect of increasing the oil production rate being below that for variations in geologic heterogeneity (~1% decrease; Figure 7A). Increasing oil production rate increases total water production by ∼7% (Figure 7A).
Stacked Delta-Lobe Deposits with Channelized Fluvial Sandbodies Always Present
In these experiments, simulated oil recovery after 10 or 20 yr of production at the target production rate (Table 1) ranges from 20% to 24% of the original oil in place. The presence or absence of laterally extensive barriers along clinoforms also has the most significant impact on oil recovery (Figure 7B). When clinoforms are covered along 90% of their area by a barrier to flow, the average effect across the models is that oil recovery is reduced by ∼3% (green bar in Figure 7B) and total water produced is increased by ∼50% (blue bar in Figure 7B). Both of these values are less than the equivalent response in the first set of experiments when FC sandbodies are absent (Figure 7A).
As in the first set of simulation experiments, increasing the vertical permeability of the dDF facies association has the most significant positive impact on oil recovery. When  , oil recovery is increased by ∼2% and total water produced is reduced by ∼50% (Figure 7B). When the effect of increasing vertical permeability is combined with that of including laterally extensive barriers to flow along clinoforms, the average response of oil recovery also increases by ∼2% (Figure 7B). Oil production rate has a more significant impact on oil recovery than in the first set of simulation experiments. Increasing oil production rate (from setting 1 to setting 2; Table 1) decreases oil production by ∼1% on average and increases total water produced by ∼8% (Figure 7B).
The permeability of the FC sandbodies does not have a significant impact in the simulation experiments. If the modeled permeability is increased by a factor of five, then oil recovery is reduced by <1% and total water production is increased by ∼1% (Figure 7B). Similarly, there is not a significant impact on either oil recovery or total water production when the effect of increased permeability of FC sandbodies is combined with that of including laterally extensive barriers to flow along clinoforms (Figure 7B).
DISCUSSION
Our results indicate that modeling barriers to flow along clinoforms has the most significant effect on hydrocarbon recovery and total water produced in models of multiple, stacked fluvial-dominated delta-lobe deposits (Figure 7). We also find that modeling FC sandbodies and non-zero vertical permeability in the dDF facies association can have a significant positive effect on hydrocarbon recovery when clinoforms are present with a 90% barrier to flow along them. The reasons for these results are discussed below, along with the implications for reservoir monitoring schemes and reservoir management strategies.
Impact of Clinoform-Surface Character, Distribution, and Associated Uncertainty
Barriers along clinoforms control the tortuosity of flow paths between injection and production wells, and hence sweep efficiency in the models. When there is no barrier coverage along clinoforms, pressure communication between injection and production wells is maintained, which leads to high sweep efficiency and oil recovery (Figure 8C). Injected water moves first through the SMB facies-association belt. The density contrast between water in the SMB facies-association belt and oil in the underlying pDF facies-association belt then causes gravity-driven downward movement of water to displace oil from the pDF deposits. The dDF facies-association belt remains largely unswept if there is no vertical permeability to allow similar gravity-driven displacement to occur (Figure 8C). When there is 90% barrier coverage along clinoforms, sweep efficiency is reduced (Figure 8E) and oil recovery decreases. The number of potential flow pathways between injection and production wells decreases, such that injected water is forced to exploit increasingly complex and tortuous flow pathways through the upper part of each clinothem, which reduces pressure communication between wells. This causes an increase in pressure drawdown at the production wells to maintain the target oil production rate, increasing the contribution of viscous forces relative to gravity forces and further suppressing the downward movement of water. The injected water exploits the shortest high-permeability pathways through the SMB facies-associated belt, which leads to earlier water breakthrough (Figure 8E). As viscous forces increasingly dominate in the reservoir, the efficiency of gravity-driven downward flow into underlying pDF deposits within each clinothem is reduced. Therefore, as barrier coverage along clinoforms increases, less oil is displaced in the pDF facies-associated belt, and oil recovery is reduced accordingly (Figure 8E). It is only possible to observe these complex sweep patterns by explicitly capturing and preserving the heterogeneity associated with clinoforms. Most significantly (and as discussed further), the flow of oil and water is affected differently by the presence of barriers to flow along clinoforms, owing to the (more or less) compartmentalized nature of clinothems and the change in the balance of viscous to gravity forces driving flow. Such effects cannot be captured simply by modifying effective (single-phase) permeability.
 Figure 8
Maps and cross sections illustrating models of stacked delta-lobe deposits that either (left) lack or (right) contain channelized fluvial sandbodies (FC), which erode down from overlying coastal-plain deposits. (A) Maps of facies-association belts near the top of the models (parasequence 1.7, Figure 3D, with the overlying coastal-plain deposits shown in Figure 3E removed) showing location of injection and production wells and the cross sections illustrated in parts B–E. (B) Depositional-dip-oriented cross section showing the internal facies architecture of the modeled delta-lobe deposits with the location of parasequence-bounding flooding surfaces (dashed black lines), with 0% barrier to flow along clinoforms. (C) Depositional-dip-oriented cross sections showing water saturation after 10 yr of production for models that lack barriers to flow along clinoforms with a target oil production rate over 10 yr of
Figure 8
Maps and cross sections illustrating models of stacked delta-lobe deposits that either (left) lack or (right) contain channelized fluvial sandbodies (FC), which erode down from overlying coastal-plain deposits. (A) Maps of facies-association belts near the top of the models (parasequence 1.7, Figure 3D, with the overlying coastal-plain deposits shown in Figure 3E removed) showing location of injection and production wells and the cross sections illustrated in parts B–E. (B) Depositional-dip-oriented cross section showing the internal facies architecture of the modeled delta-lobe deposits with the location of parasequence-bounding flooding surfaces (dashed black lines), with 0% barrier to flow along clinoforms. (C) Depositional-dip-oriented cross sections showing water saturation after 10 yr of production for models that lack barriers to flow along clinoforms with a target oil production rate over 10 yr of  (2200 bbl/day). Earlier water breakthrough occurs locally in the model lacking FC sandbodies (left). (D) Depositional-dip-oriented cross sections showing the internal facies architecture of the modeled parasequences, with barriers covering 90% of each clinoform (solic black lines) and the location of parasequence-bounding flooding surfaces (dashed black lines). (E) Corresponding cross-sections showing water saturation after 10 yr of production. Early water breakthrough occurs in both models locally when a 90% barrier to flow along clinoforms is present. DC = distributary channel sandstones; SMB = stream-mouth-bar sandstones; pDF = proximal delta-front sandstones; dDF = distal delta-front heteroliths.
Although seismic reflection data may allow the position of clinoforms to be mapped in some shallow-marine reservoirs (e.g., Dreyer et al., 2005; Patruno et al., 2015), clinoform distribution is at best only partially resolved (e.g., Holgate et al., 2014). To gain further understanding of the impact of varying clinoform distribution, oil recovery was simulated in models with spacing between clinoforms of either 25, 50, or 100 m (82, 164, or 328 ft) in models of a single delta-lobe deposit (parasequence 1.6, Figure 3C). Similarly, the impact of varying barrier coverage was analyzed in models of a single delta-lobe deposit (parasequence 1.6, Figure 3C) following the approach of previous studies in which barrier coverage was varied in 10% increments between the end-member settings of 0% and 90% (Table 1) (Howell et al., 2008a; Jackson et al., 2009; Enge and Howell, 2010). Increasing the spacing between modeled clinoforms decreases the tortuosity of flow paths between injectors and producers, such that the effects of gravity forces become more pronounced. When modeled clinoform spacing is large, there is greater pressure communication between injection and production wells, and the pressure drawdown at the production wells is relatively modest. Injected water moves rapidly through the SMB facies-association belt, and the density contrast with oil in the underlying pDF deposits causes gravity-driven downward movement of water along the clinoform to sweep the underlying pDF facies-association belt (Figure 9C). This effect is increasingly suppressed as the clinoforms become more closely spaced (Figure 9D, E). Therefore, increasing the spacing between clinoforms decreases the impact of barriers to flow along clinoforms, partly because the effective permeability increases (e.g., Begg and King, 1985) but mostly because there are fewer compartmentalized clinoforms within which oil can be bypassed (Figure 10A).
 Figure 9
(A) Distribution of facies-association belts at the top of a single delta-lobe deposit extracted from our reservoir model (parasequence 1.6, Figures 3C, 4), showing location of injection and production wells and the cross sections illustrated in parts B–E. (B) Depositional-dip-oriented cross section showing the internal facies architecture of the modeled parasequence; barriers along clinoforms are not shown. Depositional-dip-oriented cross sections showing water saturation after 15 yr of production where water has been injected via waterflooding down depositional dip, with a target oil production rate over 20 yr of
Figure 9
(A) Distribution of facies-association belts at the top of a single delta-lobe deposit extracted from our reservoir model (parasequence 1.6, Figures 3C, 4), showing location of injection and production wells and the cross sections illustrated in parts B–E. (B) Depositional-dip-oriented cross section showing the internal facies architecture of the modeled parasequence; barriers along clinoforms are not shown. Depositional-dip-oriented cross sections showing water saturation after 15 yr of production where water has been injected via waterflooding down depositional dip, with a target oil production rate over 20 yr of  (1100 bbl/day), from east to west, with 90% barrier coverage along clinoforms, for models with clinoform spacing of (C) 100 m (328 ft), (D) 50 m (164 ft), and (E) 25 m (82 ft). SMB = stream-mouth-bar sandstones; pDF = proximal delta-front sandstones; dDF = distal delta-front heteroliths.
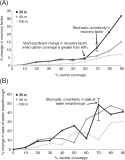 Figure 10
Change in (A) recovery factor and (B) time of water breakthrough with increasing barrier coverage for models of a single delta-lobe deposit (parasequence 1.6, Figures 3C, 4, 9) with different spacings of modeled clinoforms. Waterflooding is up structural dip and down depositional dip, with a target oil production rate over 20 yr of
Figure 10
Change in (A) recovery factor and (B) time of water breakthrough with increasing barrier coverage for models of a single delta-lobe deposit (parasequence 1.6, Figures 3C, 4, 9) with different spacings of modeled clinoforms. Waterflooding is up structural dip and down depositional dip, with a target oil production rate over 20 yr of  (1100 bbl/day). For 70% barrier coverage, a range of values is given for recovery factor and date of water breakthrough. Although the trend used to place barriers along clinoforms and the overall percentage of the surface that acts as a barrier to flow is honored, the local position of barriers along clinoforms changes with each stochastic realization. Flow-simulation results of stacked delta-lobe parasequences containing clinoforms with a 90% barrier to flow along them, spaced 100 m (328 ft) apart (Figure 7), show close correspondence with equivalent models of a single delta-lobe deposit.
A direct relationship between increasing barrier coverage and decreasing oil recovery is observed (Figure 10A). However, local variations in the positioning of barriers along clinoforms determine the location of the shortest flow pathways between injection and production wells through the SMB facies-association belt and can influence oil recovery (Figure 10A). The distribution of barriers along clinoforms is generated stochastically. Consequently, although all models honor the trend used to place barriers along clinoforms and the overall percentage of the surface that acts as a barrier to flow, the local position of barriers along clinoforms changes with each realization. The change in the local position of barriers between realizations causes small changes in the final predicted oil recovery and the exact time of water breakthrough as demonstrated by the error bar in Figure 10. The change in oil recovery and the date of water breakthrough reflect the detailed barrier distribution along clinoforms relative to the location of the high-permeability SMB facies-association belt and of the injection and production wells, as well as the proportion of barrier coverage along clinoforms.
Flow-simulation results for models of stacked delta-lobe parasequences indicate that omitting widely spaced (100 m [328 ft]) clinoforms associated with extensive barriers (90% coverage) can lead to overprediction of oil recovery by up to 5% (Figure 7), which shows close correspondence with results of equivalent models of a single delta-lobe deposit (Figure 10A). Further flow-simulation results for models of a single delta-lobe parasequence indicate that models lacking clinoforms may overpredict recovery by up to 35% for clinoforms of similar character but closer spacing (~25 m [82 ft]; Figure 10A). Our results indicate that, of the studied geologic heterogeneities and reservoir engineering parameters, barriers associated with clinoforms have the greatest impact on oil recovery in fluvial-deltaic reservoirs (Figures 7–10).
Impact of Channelized Sandbodies
Models that contain FC sandbodies have a higher oil recovery factor than equivalent models that lack such sandbodies, especially models in which there are laterally extensive barriers to flow along clinoforms (Figure 7A). The FC sandbodies (FC facies association) erode into the clinoforms from a higher stratigraphic level (Figures 5C, E, F; 11E, F), and can improve sweep efficiency by creating additional flow paths between clinothems that may otherwise be locally isolated by laterally extensive barriers or low-permeability dDF and PD deposits along their bounding clinoforms. Gravity-driven downward movement of injected water from the FC sandbodies into high-to-moderate-permeability SMB and dDF deposits in the underlying clinothems may also enhance sweep. In models that lack FC sandbodies, the shortest direct flow path between injection and production wells is through SMB sandstones, which may have similar petrophysical properties to the FC sandbodies. The FC sandbodies draw the injected water away from the shortest flow paths in SMB deposits, thus delaying water breakthrough and improving sweep (e.g., Figure 8C). The FC sandbodies also create additional flow conduits that allow otherwise isolated high-to-moderate permeability facies associations to be swept (Figure 11C, E). In models that do not contain FC sandbodies, high-permeability distributary channel-fill deposits become isolated from producers by lower permeability pDF and dDF deposits and remain largely unswept (Figure 11E). These results indicate that the geometry, continuity, and local positioning of FC sandbodies are important controls on the drainage patterns, sweep efficiency, and hydrocarbon recovery of clinoform-bearing models.
 Figure 11
Maps and cross sections illustrating models of stacked delta-lobe deposits that either (left) lack or (right) contain channelized fluvial sandbodies (FC) that erode down from overlying coastal-plain deposits. (A) Maps of facies-association belts near the top of the models (parasequence 1.7, Figure 3D, with the overlying coastal-plain deposits shown in Figure 3E removed), showing location of injection and production wells and the cross sections illustrated in parts B–E. (B) Depositional-dip-oriented cross sections showing the internal facies architecture of the modeled parasequences with barriers covering 90% of each clinoform (black lines) and parasequence-bounding flooding surfaces (dashed lines). (C) Corresponding cross section showing water saturation after 10 yr of production with a target oil production rate over 10 yr of
Figure 11
Maps and cross sections illustrating models of stacked delta-lobe deposits that either (left) lack or (right) contain channelized fluvial sandbodies (FC) that erode down from overlying coastal-plain deposits. (A) Maps of facies-association belts near the top of the models (parasequence 1.7, Figure 3D, with the overlying coastal-plain deposits shown in Figure 3E removed), showing location of injection and production wells and the cross sections illustrated in parts B–E. (B) Depositional-dip-oriented cross sections showing the internal facies architecture of the modeled parasequences with barriers covering 90% of each clinoform (black lines) and parasequence-bounding flooding surfaces (dashed lines). (C) Corresponding cross section showing water saturation after 10 yr of production with a target oil production rate over 10 yr of  (2200 bbl/day). Sweep is improved locally in the model containing FC sandbodies (right). (D) Depositional-dip-oriented cross sections showing the internal facies architecture of the modeled parasequences with barriers covering 90% of each clinoform (black lines) and parasequence-bounding flooding surfaces (dashed lines). Note that barriers near the top of the clinoforms (left) have been replaced by FC sandbodies (right). (E) Corresponding cross section showing water saturation after 10 yr of production. Sweep is improved, and earlier water breakthrough occurs locally in the model containing FC sandbodies (right). DC = distributary channel sandstones; SMB = stream-mouth-bar sandstones; pDF = proximal delta-front sandstones; dDF = distal delta-front heteroliths; PD = prodelta shales.
As the permeability of the FC sandbodies increases, recovery factor decreases (Figure 7B), because water movement through FC sandbodies that directly link injection and production wells is more rapid (Figure 12). The fluvial sandbodies act as thief zones, and sweep efficiency is reduced because the gravity-driven, downward flow of water from the FC sandbodies into underlying SMB and DC sandstones is reduced, leaving bypassed oil in the latter (Figure 12D, in comparison to Figure 12B, C). However, this effect is less pronounced than reported in Deveugle et al. (2011). The difference in the interpretation of the importance of FC sandbody permeability can be attributed to the streamline-based tracer simulations used in Deveugle et al. (2011), which do not include gravity effects. It is shown here that gravity drainage is an important mechanism for sweeping oil from some high-to-moderate permeability DC, SMB, and pDF sandstones in underlying clinothems.
 Figure 12
(A) Distribution of facies-association belts near the top of the model of stacked delta-lobe deposits containing channelized fluvial sandstones (FC) (with the coastal-plain deposits shown in Figure 3E removed), showing the location of injection and production wells. Maps of water saturation after 10 yr of production, with a target oil production rate over 10 yr of
Figure 12
(A) Distribution of facies-association belts near the top of the model of stacked delta-lobe deposits containing channelized fluvial sandstones (FC) (with the coastal-plain deposits shown in Figure 3E removed), showing the location of injection and production wells. Maps of water saturation after 10 yr of production, with a target oil production rate over 10 yr of  (2200 bbl/day) for (B) model containing 0% barrier coverage along clinoforms and FC sandbody permeability (
 ) of
) of  md, and (C, D) models containing 90% barrier coverage along clinoforms with FC sandbody permeability (
 ) of (C)
  md, and (D)
  md. Sweep efficiency is reduced when the permeability of FC sandbodies is
  md. DC = distributary channel sandstones; SMB = stream-mouth-bar sandstones; pDF = proximal delta-front sandstones; dDF = distal delta-front heteroliths; PD = prodelta shales.
Impact of Bed-Scale Heterogeneity in Distal Delta-Front Heteroliths
When the interbedded sandstones and shales of the dDF facies association are assigned zero vertical permeability, oil is only displaced from these rocks by horizontal movement of water in regions close to the injection wells (e.g., Figures 8C, 11C). Consequently, large volumes of oil are bypassed, because the dDF facies association comprises up to 55% of the model volume and holds a significant volume of oil that can be potentially recovered (Figure 13A, C). When the vertical permeability of the dDF facies association is increased, oil recovery increases and total water produced decreases (Figure 7), because water in the overlying, swept FC sandbodies or pDF facies association moves downward under gravity to displace oil in the dDF facies association (Figure 13D).
 Figure 13
Maps and cross sections illustrating models of stacked delta-lobe deposits that either have zero vertical permeability or non-zero vertical permeability in distal delta-front facies in the presence of a 90% barrier to flow along clinoforms, in models that either (left) lack or (right) contain channelized fluvial sandbodies (FC). (A) Maps of facies-association belts near the top of the models (parasequence 1.7, Figure 3D, with the overlying coastal-plain deposits shown in Figure 3E removed), showing location of injection and production wells and the cross sections illustrated in parts B–D. (B) Depositional-dip-oriented cross section showing the internal facies architecture of the modeled parasequences with barriers covering 90% of each clinoform (black lines) and parasequence-bounding flooding surfaces (dashed lines). (C, D) Depositional-dip-oriented cross section showing water saturation after 20 yr of production, with a target oil production rate over 20 yr of
Figure 13
Maps and cross sections illustrating models of stacked delta-lobe deposits that either have zero vertical permeability or non-zero vertical permeability in distal delta-front facies in the presence of a 90% barrier to flow along clinoforms, in models that either (left) lack or (right) contain channelized fluvial sandbodies (FC). (A) Maps of facies-association belts near the top of the models (parasequence 1.7, Figure 3D, with the overlying coastal-plain deposits shown in Figure 3E removed), showing location of injection and production wells and the cross sections illustrated in parts B–D. (B) Depositional-dip-oriented cross section showing the internal facies architecture of the modeled parasequences with barriers covering 90% of each clinoform (black lines) and parasequence-bounding flooding surfaces (dashed lines). (C, D) Depositional-dip-oriented cross section showing water saturation after 20 yr of production, with a target oil production rate over 20 yr of  (2200 bbl/day), where there is (C) zero vertical permeability in dDF deposits and (D) non-zero vertical permeability (
 of 7 md) in dDF deposits. Sweep is improved locally in the models containing low vertical permeability (
 of 7 md) in dDF deposits. DC = distributary channel sandstones; SMB = stream-mouth-bar sandstones; pDF = proximal delta-front sandstones; dDF = distal delta-front heteroliths.
Oil recovery and sweep of dDF deposits increases even when each clinoform is covered over 90% of its area by a barrier to flow and the dDF facies association is assigned a non-zero vertical permeability (Figures 7, 13D). However, oil recovery is lower than equivalent models containing clinoforms with 0% barrier coverage (Figure 7). This comparison suggests that the sweep efficiency of the lower part of each delta-lobe deposit is dependent on the preserved coverage of barriers along clinoforms. An increase in hydrocarbon recovery when the dDF facies association is assigned a non-zero vertical permeability supports the results of Deveugle et al. (2011), who found that increasing the  ratio of dDF deposits increased sweep efficiency. However, we find less communication between delta-lobe deposits than Deveugle et al. (2011), because of the occurrence of laterally extensive barriers along the toes of clinoforms (Figure 13D) and to the inclusion in our models of relative-permeability effects that reduce displacement efficiency in the swept part of the reservoir. The streamline-based tracer simulations used in Deveugle et al. (2011) did not include relative-permeability effects.
Impact of Oil Production Rate
Higher production rates decrease oil recovery and result in early water breakthrough (Figure 7). Increased pressure drawdown at the production wells, which is required to maintain the higher rate of oil production, causes more rapid water movement through the shortest flow paths in high-permeability FC, DC, and SMB sandstones near the tops of the delta-lobe parasequences (Figure 14B). Viscous forces associated with pressure drawdown are dominant, which results in less gravity-driven downward movement of water to displace oil in underlying, moderate-permeability pDF and low-permeability dDF sandstones near the lower part of the delta-lobe parasequences (Figure 14D). The effect is most pronounced when 90% barriers to flow along clinoforms are present, oriented perpendicular to the primary flow direction within an individual delta-lobe deposit (Figure 14D).
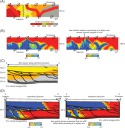 Figure 14
(A) Distribution of facies-association belts near the top of the model of stacked delta-lobe deposits containing channelized fluvial sandstones (FC) (with the coastal-plain deposits shown in Figure 3E removed), showing the location of injection and production wells. (B) Maps of water saturation for models containing 90% barrier coverage along clinoforms and non-zero vertical permeability (
Figure 14
(A) Distribution of facies-association belts near the top of the model of stacked delta-lobe deposits containing channelized fluvial sandstones (FC) (with the coastal-plain deposits shown in Figure 3E removed), showing the location of injection and production wells. (B) Maps of water saturation for models containing 90% barrier coverage along clinoforms and non-zero vertical permeability ( of 7 md) in dDF deposits, with a low target oil production rate over 20 yr of
  (1100 bbl/day) (left) and a higher target oil production rate over 10 yr of
  (2200 bbl/day) (right). (C) Depositional-dip-oriented cross section showing the internal facies architecture of the modeled parasequences with barriers covering 90% of each clinoform (black lines) and parasequence-bounding flooding surfaces (dashed lines). (D) Depositional-dip-oriented cross sections showing water saturation at the end of production using the low target oil production rate (left) and the higher target oil production rate (right). Sweep efficiency is reduced when producing at the higher oil production rate. DC = distributary channel sandstones; SMB = stream-mouth-bar sandstones; pDF = proximal delta-front sandstones; dDF = distal delta-front heteroliths.
Implications for Reservoir Monitoring and Management
The presence and extent of barriers to flow along clinoforms is difficult to characterize in the subsurface. Seismic data may, in some cases, identify a change in lithology at, or across clinoforms (e.g., Dreyer et al., 2005; Holgate et al., 2014; Patruno et al., 2015), but such changes are not consistently imaged. Similarly, core and wireline-log data may allow the identification of clinoforms at a limited number of locations within the reservoir, but the extent of barrier coverage away from well penetrations is difficult to evaluate. Here, we use pressure and water saturation profiles along wells to monitor the development of breaks across clinoforms during production in the models of stacked delta-lobe deposits (Figure 15).
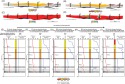 Figure 15
(A, B) Cross sections of facies-association belts along the structural crest of two models containing multiple, stacked delta-lobe deposits (with the coastal-plain deposits shown in Figure 3E removed), showing the location of production wells: (A) 0% barrier to flow along clinoforms, non-zero vertical permeability (
Figure 15
(A, B) Cross sections of facies-association belts along the structural crest of two models containing multiple, stacked delta-lobe deposits (with the coastal-plain deposits shown in Figure 3E removed), showing the location of production wells: (A) 0% barrier to flow along clinoforms, non-zero vertical permeability ( of 7 md) in distal delta-front heteroliths (dDF) deposits, and no channelized fluvial sandbodies (FC); and (B) 90% barrier to flow along clinoforms, zero vertical permeability in dDF deposits, and FC sandbodies present. Pressure and water-saturation profiles along the labeled well in both models are shown in parts E–I. (C, D) Corresponding cross sections showing water saturation after 10 yr of production with a target oil production rate over 10 yr of
  (2200 bbl/day). (E–I) Facies-association successions, stratigraphic surfaces, and pressure and water-saturation profiles after 10 yr of production along production well (labeled with asterisk in parts A–D), with dashed lines denoting clinoforms and black lines representing parasequence bounding flooding surfaces. Well data extracted from five models are shown, with increasing heterogeneity from left to right: (E) 0% barrier to flow along clinoforms, non-zero vertical permeability (
 of 7 md) in dDF deposits, and no FC sandbodies; (F) 0% barrier to flow along clinoforms, zero vertical permeability in dDF deposits, and no FC sandbodies; (G) 90% barrier to flow along clinoforms, non-zero vertical permeability (
 of 7 md) in dDF deposits, and no FC sandbodies; (H) 90% barrier to flow along clinoforms, zero vertical permeability in dDF deposits, and no FC sandbodies; and (I) 90% barrier to flow along clinoforms, zero vertical permeability in dDF deposits, and FC sandbodies present. SMB = stream-mouth-bar sandstones; pDF = proximal delta-front sandstones.
When clinoforms are not associated with significant barriers to flow, no breaks in pressure occur along them (Figure 15E), and pressure breaks only result from a significant contrast in petrophysical properties between pDF and dDF facies associations in models where there is zero vertical permeability in dDF facies (Figure 15F). Such pressure breaks may become more subtle in the presence of gradational facies contacts. Even clinoforms with 90% barrier coverage along them are associated with only small breaks in pressure (Figure 15H, I), making it difficult to detect their presence using downhole pressure measurements alone. However, such clinoforms are associated with prominent breaks in water saturation (Figure 15G–I), indicating that sweep becomes stratigraphically compartmentalized. In models that both contain and lack FC sandbodies, gravity-driven downward flow of water caused by the density contrast between water and oil stops at barriers along clinoforms. Similar breaks in water saturation across clinoforms have been observed in models of an outcrop analog of a wave-dominated shoreface-shelf parasequences (Jackson et al., 2009), in surveillance data from the wave-dominated Rannoch and Etive formations of the Brent Group reservoir, Brent Field, United Kingdom North Sea (Hampson et al., 2008), and the storm-dominated Jurassic Bridport Sandstone Formation reservoir, Wytch Farm field, southern United Kingdom (Hampson et al., 2014). The complex sweep patterns observed in our models have implications for history matching: if clinoforms have been erroneously omitted, the wrong properties may be adjusted in models to match observed data, yielding reservoir models with little or no predictive value.
CONCLUSIONS
A novel, stochastic, surface-based, clinoform-modeling algorithm and data from an outcrop analog (Cretaceous Ferron Sandstone Member, Utah) have been used to construct 3-D models of multiple, stacked fluvial-dominated delta-lobe deposits, each of which contains numerous clinoform surfaces. The models were then used to quantify the impact on oil recovery of geologic heterogeneity and reservoir engineering decisions. The investigated geologic heterogeneities include the distribution and character of clinoforms, occurrence and character of fluvial channelized sandbodies, and the vertical permeability of interbedded sandstones and shales in distal delta-front deposits.
The proportion and distribution of barriers to flow along clinoforms are found to exert the greatest influence on recovery; equivalent models that neglect these barriers overpredict recovery by up to 35%. Furthermore, the impact of clinoforms is typically larger than that of other geologic heterogeneities and reservoir engineering decisions.
The vertical permeability of the dDF facies association has the most significant positive impact on oil recovery; when vertical permeability is non-zero, oil recovery is increased by up to 2% in comparison to models with zero vertical permeability in the dDF facies association. Oil recovery increases, because water in the overlying, swept FC sandbodies or pDF facies association moves downward under gravity to displace oil in the dDF facies association.
The models provide insights into the data types required to appropriately characterize, monitor, and manage fluvial-dominated deltaic reservoirs containing clinoforms. Although they exert a significant impact on sweep and recovery, clinoforms are only rarely associated with large breaks in pressure in production wells. However, clinoforms associated with significant barriers to flow are marked by prominent breaks in water saturation that may be detected and monitored in production wells to characterize clinoform-related sweep patterns during production. Our results also suggest that history matching of observed sweep patterns and pressure data would lead to erroneous predictions of future production behavior in models lacking clinoforms. Therefore, clinoforms that are interpreted to be lined by significant flow barriers or to be marked by pronounced permeability contrasts should be included routinely in models of fluvial-dominated deltaic reservoirs to accurately predict hydrocarbon recovery and drainage patterns.
REFERENCES CITED
Ainsworth, B. R., M. Sanlung, and S. T. C. Duivenvoorden, 1999, Correlation techniques, perforation strategies, and recovery factors: An integrated 3-D reservoir modeling study, Sirikit field, Thailand: AAPG Bulletin, v. 83, p. 1535–1551.
Anderson, W. G., 1987, Wettability literature survey—Part 5: The effects of wettability on relative permeability: Journal of Petroleum Technology, v. 39, p. 1454–1468.
Anderson, P. B., and T. A. Ryer, 2004, Regional stratigraphy of the Ferron Sandstone, inT. C. Chidsey, Jr., R. D. Adams, and T. H. Morris, eds., Regional to wellbore analog for fluvial-deltaic reservoir modeling: The Ferron Sandstone of Utah: AAPG Studies in Geology 50, p. 211–224.
Barrell, J., 1912, Criteria for the recognition of ancient delta deposits: Geological Society of America Bulletin, v. 23, no. 1, p. 377–446, doi: 10.1130/GSAB-23-377.
Begg, S. H., and D. M. Chang, 1985, A simple statistical method for calculating the effective vertical permeability of a reservoir containing discontinuous shales: SPE Paper 14271, 15 p.
Begg, S. H., E. R. Gustason, and M. W. Deacon, 1992, Characterization of a fluvial-dominated delta: Zone 1 of the Prudhoe Bay field: SPE Paper 24698, 14 p.
Begg, S. H., and P. R. King, 1985, Modeling the effects of shales on reservoir performance: Calculation of effective vertical permeability: SPE Paper 13529, 15 p.
Bhattacharya, J. P., 2006, Deltas, inH. W. Posamentier, and R. Walker, eds., Facies models revisited: Tulsa, Oklahoma, SEPM Special Publication 84, p. 237–292.
Box, G. E. P., and N. R. Draper, 1987, Empirical model building and response surfaces: New York, Wiley, 669 p.
Coleman, J. M., 1988, Dynamic changes and processes in the Mississippi River Delta: Geological Society of America Bulletin, v. 100, no. 7, p. 999–1015, doi: 10.1130/0016-7606(1988)100<0999:DCAPIT>2.3.CO;2.
Cotter, E., 1976, The role of deltas in the evolution of the Ferron Sandstone and its coals: Brigham Young University Studies in Geology, v. 22, p. 15–41.
Deveugle, P. E. K., M. D. Jackson, G. J. Hampson, M. E. Farrell, A. R. Sprague, J. Stewart, and C. S. Calvert, 2011, Characterization of stratigraphic architecture and its impact on fluid flow in a fluvial-dominated deltaic reservoir analog: Upper Cretaceous Ferron Sandstone Member, Utah: AAPG Bulletin, v. 95, no. 5, p. 693–727, doi: 10.1306/09271010025.
Dreyer, T., M. Whitaker, J. Dexter, H. Flesche, and E. Larsen, 2005, From spit system to tide-dominated delta: Integrated reservoir model of the Upper Jurassic Sognefjord Formation on the Troll West field, inA. G. Doré, and B. A. Vining, eds., Petroleum geology: From mature basins to new frontiers—Proceedings of the 6th Petroleum Geology Conference: Petroleum Geology Conference Series 6: London, Geological Society, p. 423–448.
Dutton, S. P., B. J. Willis, C. D. White, and J. P. Bhattacharya, 2000, Outcrop characterization of reservoir quality and interwell-scale cement distribution in a tide-influenced delta, Frontier Formation, Wyoming, USA: Clay Minerals, v. 35, no. 1, p. 95–105, doi: 10.1180/000985500546756.
Eide, C. H., J. A. Howell, and S. Buckley, 2014, Distribution of discontinuous mudstone beds within wave-dominated shallow-marine deposits: Star Point Sandstone and Blackhawk Formation, eastern Utah: AAPG Bulletin, v. 98, no. 7, p. 1401–1429, doi: 10.1306/01201413106.
Enge, H. D., and J. A. Howell, 2010, Impact of deltaic clinothems on reservoir performance: Dynamic studies of reservoir analogs from the Ferron Sandstone Member and Panther Tongue, Utah: AAPG Bulletin, v. 94, no. 2, p. 139–161, doi: 10.1306/07060908112.
Enge, H. D., J. A. Howell, and S. Buckley, 2010, The geometry and internal architecture of stream mouth bars in the Panther Tongue and the Ferron Sandstone Members, Utah, U.S.A.: Journal of Sedimentary Research, v. 80, no. 11, p. 1018–1031, doi: 10.2110/jsr.2010.088.
Forster, C. B., S. H. Snelgrove, and J. V. Koebbe, 2004, Modelling permeability structure and simulating fluid flow in a reservoir analog: Ferron Sandstone, Ivie Creek area, east-central Utah, inT. C. Chidsey, Jr., R. D. Adams, and T. H. Morris, eds., Regional to wellbore analog for fluvial-deltaic reservoir modeling: The Ferron Sandstone of Utah: AAPG Studies in Geology 50, p. 359–382.
Frazier, D. E., 1967, Recent deltaic deposits of the Mississippi River: Their development and chronology: Transactions of the Gulf Coast Association of Geological Societies, v. 17, p. 287–315.
Galloway, W. E., 1989, Genetic stratigraphic sequences in basin analysis I: Architecture and genesis of flooding-surface bounded depositional units: AAPG Bulletin, v. 73, p. 125–142.
Gani, M. R., and J. P. Bhattacharya, 2005, Lithostratigraphy versus chronostratigraphy in facies correlations of Quaternary deltas: Application of bedding correlation, inL. Giosan, and J. P. Bhattacharya, eds., River deltas—Concepts, models and examples: SEPM Special Publication 83, p. 31–47.
Gani, M. R., and J. P. Bhattacharya, 2007, Basic building blocks and process variability of a Cretaceous delta: Internal facies architecture reveals a more dynamic interaction of river, wave, and tidal processes than is indicated by external shape: Journal of Sedimentary Research, v. 77, no. 4, p. 284–302, doi: 10.2110/jsr.2007.023.
Garrison, J. R., Jr., and T. C. V. Van den Bergh, 2004, High resolution depositional sequence stratigraphy of the Upper Ferron Sandstone Last Chance Delta: An application of coal-zone stratigraphy, inT. C. Chidsey, Jr., R. D. Adams, and T. H. Morris, eds., Regional to wellbore analog for fluvial-deltaic reservoir modelling: The Ferron Sandstone of Utah: AAPG Studies in Geology 50, p. 125–192.
Graham, G. H., M. D. Jackson, and G. J. Hampson, 2015, Three-dimensional modeling of clinoforms within shallow-marine reservoirs: Part 1. Concepts and application: AAPG Bulletin, v. 99, p. 1013–1047, doi: 10.1306/01191513190.
Haldorsen, H. H., and L. W. Lake, 1984, A new approach to shale management in field-scale models: SPE Journal, v. 24, no. 4, p. 447–457, doi: 10.2118/10976-PA.
Hampson, G. J., 2000, Discontinuity surfaces, clinoforms and facies architecture in a wave-dominated, shoreface-shelf parasequence: Journal of Sedimentary Research, v. 70, no. 2, p. 325–340, doi: 10.1306/2DC40914-0E47-11D7-8643000102C1865D.
Hampson, G. J., J. E. Morris, and H. D. Johnson, 2014, Synthesis of time-stratigraphic relationships and their impact on hydrocarbon reservoir distribution and performance, Bridport Sand Formation, Wessex Basin, UK, inD. G. Smith, R. J. Bailey, P. M. Burgess, and A. J. Fraser, eds., Strata and time: Probing the gaps in our understanding: Geological Society, London, Special Publication 404, first published online on March 19, 2014, doi: 10.1144/SP404.2.
Hampson, G. J., A. B. Rodriguez, J. E. A. Storms, H. D. Johnson, and C. T. Meyer, 2008, Geomorphology and high-resolution stratigraphy of progradational wave-dominated shoreline deposits: Impact on reservoir-scale facies architecture, inG. J. Hampson, R. J. Steel, P. M. Burgess, and R. W. Dalrymple, eds., Recent advances in models of siliciclastic shallow-marine stratigraphy: SEPM Special Publication 90, p. 117–142.
Holgate, N. E., G. J. Hampson, C. A.-L. Jackson, and S. A. Petersen, 2014, Constraining uncertainty in interpretation of seismically imaged clinoforms in deltaic reservoirs, Troll field, Norwegian North Sea: Insights from forward seismic models of outcrop analogs: AAPG Bulletin, v. 98, no. 12, p. 2629–2663, doi: 10.1306/05281413152.
Howell, J. A., A. Skorstad, A. MacDonald, A. Fordham, S. Flint, B. Fjellvoll, and T. Manzocchi, 2008a, Sedimentological parameterization of shallow-marine reservoirs: Petroleum Geoscience, v. 14, no. 1, p. 17–34, doi: 10.1144/1354-079307-787.
Howell, J. A., Å. Vassel, and T. Aune, 2008b, Modelling of dipping clinoform barriers within deltaic outcrop analogues from the Cretaceous Western Interior Basin, U.S.A., inA. Robinson, P. Griffiths, S. Price, J. Hegre, and A. H. Muggeridge, eds., The future of geologic modelling in hydrocarbon development: Geological Society, London, Special Publication 309, p. 99–121.
Hoyal, D. C. J. D., and B. A. Sheets, 2009, Morphodynamic evolution of experimental cohesive deltas: Journal of Geophysical Research: Earth Surface, v. 114, no. F2, 18 p., doi: 10.1029/2007JF000882.
Husmo, T., G. P. Hamar, O. Høiland, J. P. Johannessen, A. Rømuld, A. M. Spencer, and R. Titterton, 2003, Lower and Middle Jurassic, inD. Evans, C. Graham, A. Armour, and P. Bathurst, eds., The millennium atlas: Petroleum geology of the central and northern North Sea: London, Geological Society, p. 129–156.
Jackson, M. D., G. J. Hampson, J. H. Saunders, A. El Sheikh, G. H. Graham, and B. Y. G. Massart, 2014, Surface-based reservoir modelling for flow simulation, inA. W. Martinius, J. A. Howell, and T. R. Good, eds., Sediment-body geometry and heterogeneity: Analogue studies for modelling the subsurface: Geological Society, London, Special Publication 387, p. 271–292.
Jackson, M. D., G. J. Hampson, and R. P. Sech, 2009, Three-dimensional modeling of a shoreface-shelf parasequence reservoir analog: Part 2. Geological controls on fluid flow and hydrocarbon production: AAPG Bulletin, v. 93, no. 9, p. 1183–1208, doi: 10.1306/05110908145.
Jackson, M. D., and A. H. Muggeridge, 2000, The effect of discontinuous shales on reservoir performance during immiscible flow: SPE Journal, v. 5, no. 4, p. 446–455, doi: 10.2118/69751-PA.
Kjønsvik, D., J. Doyle, T. Jacobsen, and A. Jones, 1994, The effects of sedimentary heterogeneities on production from a shallow marine reservoir—What really matters?: SPE Paper 28445, 14 p.
Lee, K., M. D. Gani, G. A. McMechan, J. P. Bhattacharya, S. Nyman, and X. Zeng, 2007, Three-dimensional facies architecture and three-dimensional calcite concretion distributions in a tide-influenced delta front, Wall Creek Member, Frontier Formation, Wyoming: AAPG Bulletin, v. 91, no. 2, p. 191–214, doi: 10.1306/08310605114.
Matthews, S., J. C. Carter, K. D. Stephen, R. W. Zimmerman, A. Skorstad, T. Manzocchi, and J. A. Howell, 2008, Assessing the effect of geological uncertainty on recovery estimates in shallow-marine reservoirs: The application of reservoir engineering to the SAIGUP project: Petroleum Geoscience, v. 14, no. 1, p. 35–44, doi: 10.1144/1354-079307-791.
Mattson, A., and M. A. Chan, 2004, Facies and permeability relationships for wave-modified and fluvial-dominated deposits of the Cretaceous Ferron Sandstone, central Utah, inT. C. Chidsey, Jr., R. D. Adams, and T. H. Morris, eds., Regional to wellbore analog for fluvial-deltaic reservoir modeling: The Ferron Sandstone of Utah: AAPG Studies in Geology 50, p. 251–275.
Mulder, T., J. P. M. Syvitski, S. Migeon, J.-C. Faugéres, and B. Savoye, 2003, Marine hyperpycnal flows: Initiation, behaviour and related deposits: A review: Marine and Petroleum Geology, v. 20, no. 6–8, p. 861–882, doi: 10.1016/j.marpetgeo.2003.01.003.
Muto, T., and R. J. Steel, 1992, Retreat of the front in a prograding delta: Geology, v. 20, no. 11, p. 967–970, doi: 10.1130/0091-7613(1992)020<0967:ROTFIA>2.3.CO;2.
Muto, T., R. J. Steel, and J. B. Swenson, 2007, Autostratigraphy: A framework norm for genetic stratigraphy: Journal of Sedimentary Research, v. 77, no. 1, p. 2–12, doi: 10.2110/jsr.2007.005.
Newman, K. F., and M. A. Chan, 1991, Depositional facies and sequences in the Upper Cretaceous Panther Tongue Member of the Star Point Formation, Wasatch Plateau, Utah, inT. C. Chidsey, Jr., ed., Geology of east-central Utah: Utah Geological Association Publication 19, p. 65–75.
Olariu, C., and J. P. Bhattacharya, 2006, Terminal distributary channels and delta front architecture of river-dominated delta systems: Journal of Sedimentary Research, v. 76, no. 2, p. 212–233, doi: 10.2110/jsr.2006.026.
Olariu, C., R. J. Steel, and A. L. Petter, 2010, Delta-front hyperpycnal bed geometry and implications for reservoir modeling: Cretaceous Panther Tongue delta, Book Cliffs, Utah: AAPG Bulletin, v. 94, no. 6, p. 819–845, doi: 10.1306/11020909072.
Patruno, S., G. J. Hampson, C. A.-L. Jackson, and T. Dreyer, 2015, Clinoform geometry, geomorphology, facies character and stratigraphic architecture of a sand-rich subaqueous delta: Jurassic Sognefjord Formation, offshore Norway: Sedimentology, v. 62, no. 1, p. 350–388, doi: 10.1111/sed.12153.
Reynolds, A. D., 1999, Dimensions of paralic sandstone bodies: AAPG Bulletin, v. 83, p. 211–238.
Rich, J. L., 1951, Three critical environments of deposition, and criteria for recognition of rocks deposited in each of them: Geological Society of America Bulletin, v. 62, no. 1, p. 1–20, doi: 10.1130/0016-7606(1951)62[1:TCEODA]2.0.CO;2.
Roberts, H. H., R. H. Fillon, B. Kohl, J. M. Robalin, and J. C. Sydow, 2004, Depositional architecture of the Lagniappe Delta; sediment characteristics, timing of depositional events, and temporal relationship with adjacent shelf-edge deltas, inJ. B. Anderson, and R. H. Fillon, eds., Late Quaternary stratigraphic evolution of the northern Gulf of Mexico margin: Tulsa, Oklahoma, SEPM Special Publication 79, p. 143–188.
Ryer, T. A., and P. B. Anderson, 2004, Facies of the Ferron Sandstone, east-central Utah, inT. C. Chidsey, Jr., R. D. Adams, and T. H. Morris, eds., Regional to wellbore analog for fluvial-deltaic reservoir modeling: The Ferron Sandstone of Utah: AAPG Studies in Geology 50, p. 59–78.
Sech, R. P., M. D. Jackson, and G. J. Hampson, 2009, Three-dimensional modeling of a shoreface-shelf parasequence reservoir analog: Part 1. Surface-based modeling to capture high resolution facies architecture: AAPG Bulletin, v. 93, no. 9, p. 1155–1181, doi: 10.1306/05110908144.
Stiles, J. H., and J. M. Hutfilz, 1992, The use of routine and special core analysis in characterizing Brent Group reservoirs, UK North Sea: Journal of Petroleum Technology, v. 44, no. 6, p. 704–713, doi: 10.2118/18386-PA.
Tollas, J. M., and A. McKinney, 1991, Brent field 3D reservoir simulation: Journal of Petroleum Technology, v. 43, no. 5, p. 589–595, doi: 10.2118/18306-PA.
Tye, R. S., 2004, Geomorphology: An approach to determining subsurface reservoir dimensions: AAPG Bulletin, v. 88, no. 8, p. 1123–1147, doi: 10.1306/02090403100.
Tye, R. S., J. P. Bhattacharya, J. A. Lorsong, S. T. Sindelar, D. G. Knock, D. D. Puls, and R. A. Levinson, 1999, Geology and stratigraphy of fluvio-deltaic deposits in the Ivishak formation: Applications for development of Prudhoe Bay field, Alaska: AAPG Bulletin, v. 83, p. 1588–1623.
Van de Graaf, W., and P. Ealey, 1989, Geologic modeling for simulation studies: AAPG Bulletin, v. 73, p. 1436–1444.
Van Wagoner, J. C., R. M. Mitchum, K. M. Campion, and V. D. Rahmanian, 1990, Siliciclastic sequence stratigraphy in well logs, cores and outcrops: Concepts for high-resolution correlation of time and facies: AAPG Methods in Exploration Series, no. 7, 55 p.
Wehr, F. L., and L. D. Brasher, 1996, Impact of sequence-based correlation style on reservoir model behavior, lower Brent Group, North Cormorant field, UK North Sea, inJ. A. Howell, and J. F. Aitken, eds., High resolution sequence stratigraphy: Innovations and applications: Geological Society, London, Special Publication 104, p. 115–128.
Wellner, R., R. Beaubouef, J. C. Van Wagoner, H. H. Roberts, and T. Sun, 2005, Jet-plume depositional bodies—The primary building blocks of Wax Lake Delta: Transactions of the Gulf Coast Association of Geological Societies, v. 55, p. 867–909.
White, C. D., and M. D. Barton, 1999, Translating outcrop data to flow models, with applications to the Ferron Sandstone: SPE Reservoir Evaluation and Engineering, v. 2, no. 4, p. 341–350, doi: 10.2118/57482-PA.
White, C. D., and B. J. Willis, 2000, A method to estimate length distributions from outcrop data: Mathematical Geology, v. 32, no. 4, p. 389–419, doi: 10.1023/A:1007510615051.
Willis, B. J., and C. D. White, 2000, Quantitative outcrop data for flow simulation: Journal of Sedimentary Research, v. 70, no. 4, p. 788–802, doi: 10.1306/2DC40938-0E47-11D7-8643000102C1865D.
AUTHORS
Gavin H. Graham is a research geologist with TOTAL, based in the Geoscience Research Centre in Aberdeen, UK. He holds an M.Eng. in chemical engineering from the University of Edinburgh. His research interests lie in novel reservoir modeling methods and quantifying the influence of geologic heterogeneity on fluid flow behavior and hydrocarbon recovery. The research for this article was conducted as a part of his Ph.D. research at Imperial College London.
Matthew D. Jackson is the TOTAL chair of geological fluid mechanics in the Department of Earth Science and Engineering, Imperial College, London. He holds a B.S. degree in physics from Imperial College and a Ph.D. in geological fluid mechanics from the University of Liverpool. His research interests include simulation of multiphase flow through porous media, representation of geologic heterogeneity in simulation models, and downhole monitoring and control in instrumented wells.
Gary J. Hampson is a reader in sedimentary geology in the Department of Earth Science and Engineering, Imperial College, London. He holds a B.A. degree in natural sciences from the University of Cambridge and a Ph.D. in sedimentology and sequence stratigraphy from the University of Liverpool. His research interests lie in the understanding of depositional systems and their preserved stratigraphy and in applying this knowledge to reservoir characterization.
ACKNOWLEDGEMENTS
Funding for this work is gratefully acknowledged from the United Kingdom Natural Environment Research Council (NERC) and ExxonMobil Upstream Research Company. We thank Roxar for providing the RMS® software with which models were gridded and visualized, and Schlumberger for providing the Petrel® and the Eclipse 100 software with which production under waterflooding was simulated. The authors thank Greg Benson, Colin Lyttle, and Greg Robertson (ExxonMobil) for constructive criticism during the development of the models for flow simulation and Alyssia Janczak and Charles Faure-Llorens (Imperial College London) for their contribution to early prototypes of the models. We gratefully acknowledge Janok Bhattacharya, John Howell, Colin North, Michael Sweet, Frances Whitehurst, and an anonymous reviewer for their constructive reviews and editorial comments.