The AAPG/Datapages Combined Publications Database
AAPG Bulletin
Figure
AAPG Bulletin; Year: 2015; Issue: June DOI: 10.1306/01191513191
Return to Full Text
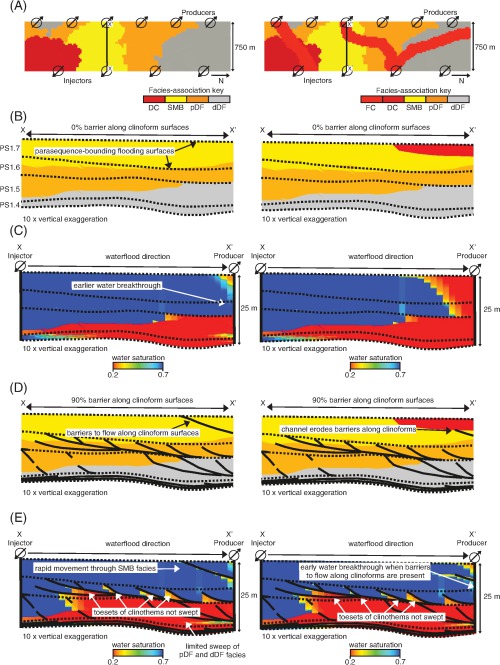
Figure 8
Maps and cross sections illustrating models of stacked delta-lobe deposits that either (left) lack or (right) contain channelized fluvial sandbodies (FC), which erode down from overlying coastal-plain deposits. (A) Maps of facies-association belts near the top of the models (parasequence 1.7, Figure 3D, with the overlying coastal-plain deposits shown in Figure 3E removed) showing location of injection and production wells and the cross sections illustrated in parts B–E. (B) Depositional-dip-oriented cross section showing the internal facies architecture of the modeled delta-lobe deposits with the location of parasequence-bounding flooding surfaces (dashed black lines), with 0% barrier to flow along clinoforms. (C) Depositional-dip-oriented cross sections showing water saturation after 10 yr of production for models that lack barriers to flow along clinoforms with a target oil production rate over 10 yr of  (2200 bbl/day). Earlier water breakthrough occurs locally in the model lacking FC sandbodies (left). (D) Depositional-dip-oriented cross sections showing the internal facies architecture of the modeled parasequences, with barriers covering 90% of each clinoform (solic black lines) and the location of parasequence-bounding flooding surfaces (dashed black lines). (E) Corresponding cross-sections showing water saturation after 10 yr of production. Early water breakthrough occurs in both models locally when a 90% barrier to flow along clinoforms is present. DC = distributary channel sandstones; SMB = stream-mouth-bar sandstones; pDF = proximal delta-front sandstones; dDF = distal delta-front heteroliths.
Figure 8
Maps and cross sections illustrating models of stacked delta-lobe deposits that either (left) lack or (right) contain channelized fluvial sandbodies (FC), which erode down from overlying coastal-plain deposits. (A) Maps of facies-association belts near the top of the models (parasequence 1.7, Figure 3D, with the overlying coastal-plain deposits shown in Figure 3E removed) showing location of injection and production wells and the cross sections illustrated in parts B–E. (B) Depositional-dip-oriented cross section showing the internal facies architecture of the modeled delta-lobe deposits with the location of parasequence-bounding flooding surfaces (dashed black lines), with 0% barrier to flow along clinoforms. (C) Depositional-dip-oriented cross sections showing water saturation after 10 yr of production for models that lack barriers to flow along clinoforms with a target oil production rate over 10 yr of (2200 bbl/day). Earlier water breakthrough occurs locally in the model lacking FC sandbodies (left). (D) Depositional-dip-oriented cross sections showing the internal facies architecture of the modeled parasequences, with barriers covering 90% of each clinoform (solic black lines) and the location of parasequence-bounding flooding surfaces (dashed black lines). (E) Corresponding cross-sections showing water saturation after 10 yr of production. Early water breakthrough occurs in both models locally when a 90% barrier to flow along clinoforms is present. DC = distributary channel sandstones; SMB = stream-mouth-bar sandstones; pDF = proximal delta-front sandstones; dDF = distal delta-front heteroliths.