The AAPG/Datapages Combined Publications Database
AAPG Bulletin
Full Text
![]() Click to view page images in PDF format.
Click to view page images in PDF format.
AAPG Bulletin, V.
 2015. The American Association of Petroleum Geologists. All rights reserved. Gold Open Access. This paper is published under the terms of the CC-BY license.
DOI: 10.1306/070615045
What to expect when you are prospecting: How new information changes our estimate of the chance of success of a prospect
Frank J. Peel1
and John R. V. Brooks2
1National Oceanography Centre, University of Southampton, Waterfront Campus, European Way, Southampton SO14 3ZH, United Kingdom; [email protected]
2National Oceanography Centre, University of Southampton, Waterfront Campus, European Way, Southampton SO14 3ZH, United Kingdom; [email protected]; [email protected]
ABSTRACT
There is a common belief that we can expect to add value to a prospect or prospect portfolio by improving the prospect chance of success (Pg) as a consequence of acquiring information and doing work. Established laws of probability dictate that this is incorrect. We do expect new information to add value to the exploration cycle, but not by an expectation of improving the prospect risk. New information may result in an increase or a decrease of Pg, but the expected result (the average of all possible outcomes) is zero change. Moreover, for a typical exploration prospect (Pg < 0.5), we expect that new information will downgrade more prospects Pg than are upgraded. Real-world prospect data are neither suitable nor publically available to study this. Instead, the concept is explored using an analogous process (prenatal prediction of fetus gender) for which good statistics exist, and by creating a synthetic prospect that can be analyzed in a repeatable way. The results support the predictions made above.
INTRODUCTION
There are in existence a selection of sources that deal with the estimation of prospect risk (e.g., Megill, 1977; Rose, 2001), the value of information (VoI) in the petroleum exploration business (e.g., Coopersmith et al., 2006; Bratvold et al., 2009), and the optimization of business decisions using that information (e.g., Bratvold and Begg, 2010). However, these include little discussion of the way in which new information changes our estimate of the chance of success (Pg) of a prospect, and in particular whether we can expect new information to improve or downgrade that estimate.
Reading of some of these excellent texts could indicate that we expect new information to improve our odds; for example, Rose (2001, p. 93) states “the most common method of improving the odds is to acquire additional geotechnical information, such as seismic or geochemical data.” What the casual reader may not learn from this sentence is that the same information could equally worsen those odds.
Other quotes that appear to support the expectation that spending time and effort on new work, new technology, and new data should be rewarded by an improvement in the chance of success include the following: “effective exploration is a process of risk reduction…” which continues until “… a stage of rapidly diminishing returns in terms of further risk reduction per unit of exploration information is reached” (Duff and Hall, 1996, p. 184–185); “a powerful battery of tools with which to reduce risk are available” (Kaufman, 1996, p. 136); “integrating technologies helps to reduce risk” (Bender et al., 2010, p. 13, who also noted explicitly that the industry invests significant amounts of money and time to reduce risk); and “high risks, inherently entrenched in any petroleum assessment and exploration … can be reduced by using probability methods at different stages of assessment and exploration activities” (Divi, 2004, p. 95). Such language may give the impression (even if that was not the intention of the authors) that by using these tools we should expect to improve the chance of success of a prospect.
The existence of an expectation of reward by prospect risk reduction is also indicated by the titles of recent international conferences, “Reducing Subsurface Uncertainty and Risk through Field-Based Studies” (Geological Society of London, 2014) and “Recent Advances in Exploration Technology and NCS Prospect Fair; Identify Opportunities—Reduce Risk” (Geological Society of Norway, 2015).
Our own experience, based on interaction with many individuals in different companies, is that there is a common, but not universal, belief that effort and money spent acquiring new information on exploration prospects should result in an improved chance of success. Our experience indicates that this belief varies between individuals and, to some extent, between different companies (a reviewer of this paper noted that he has never experienced it in his company; however, a reviewer of a different paper stipulated that a properly designed work program should improve risk).
In consequence, experienced members of the petroleum exploration community may have heard the like of: “We will acquire 3-D seismic coverage over our X Block, which will add value by de-risking our prospects” or “Your job this year will be to remap and mature the Y prospect to drillable status; your performance target will include raising the prospect Pg from 0.2 to at least 0.3.”
Implicit to such statements is a belief that is simple, seductive, and wrong; namely that, by carrying out work or acquiring new information, we can expect to improve the estimated chance of success of an existing prospect or prospect portfolio. This can have destructive results for a company that banks its future on the expectation of improving prospect risks or for a team or individual who lives with the consequence of an unwinnable performance contract.
Two components of measure of the value of a portfolio of prospects are the risked prospective resource and the number of discoveries expected if the portfolio is drilled out. Both of these value components depend on the estimated chance of success of the prospects. Peel and White (in press) discuss the belief that we can expect to improve prospect risk by work or new information, and suggest this is rooted in the labor theory of value (Smith, 1776). Russell (1946, p. 578) discussed the origin of this theory, tracing it to medieval texts stating that “value … should increase in relation to the amount of labor which has been expended.” The belief that effort should be rewarded with an increase in value appeals both to our sense of fair play and to our everyday human experience, but it should not apply to prospect risk. Peel and White (in press) propose two rules that should apply to how prospect risk changes when we gain new information:
Rule (1): you should not expect to improve Pg by acquiring new data. Some prospects will see improved Pg, some will become worse, but the expected value of Pg (the average of all possible outcomes) will be unchanged.
Rule (2): you should expect Pg to become worse for the majority of prospects in a portfolio, although the expected average value of Pg of the portfolio will be unchanged.
These rules are somewhat counterintuitive, but they are important and they should form the basis of what we expect an exploration work plan to deliver. This paper aims to provide more explanation and demonstrate the significance of the rules by means of worked examples.
RISK, CHANCE OF SUCCESS, AND UNCERTAINTY
The concept of chance of prospect success is critical to the understanding of prospect economics and/or for modeling of a prospect portfolio (e.g., Allais, 1956; Newendorp, 1971, 1975; Megill, 1977; Rose, 1987, 2001). It is, therefore, vital to have a clear definition of this term, but the literature remains somewhat inconsistent as to how it should be defined; we therefore start by setting out a clear definition.
Every exploration prospect, before it is drilled, should have a clearly defined geological success case model describing all its components (e.g., the success model for a notional Y prospect could be that it is a four-way closure, containing deepwater turbidite sands deposited in a slope channel, sealed by a marine shale, sourced by a defined source rock, etc.). We define the parameter ranges (e.g., reservoir porosity, closure height, volume of migrated hydrocarbons, etc.) that the success case geology could deliver, and use these to calculate the range of possible hydrocarbon volumes that the prospect success case model as a whole could deliver, which can be described as probability density and exceedance curves (Figure 1).
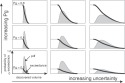 Figure 1.
The difference between chance of success (risk) (Pg) and confidence for a prospect. Increasing uncertainty is reflected by a broadening of the error range on the predicted success case volume, which is represented by an exceedance curve (black) and by a probability density function (gray filled curve).
Figure 1.
The difference between chance of success (risk) (Pg) and confidence for a prospect. Increasing uncertainty is reflected by a broadening of the error range on the predicted success case volume, which is represented by an exceedance curve (black) and by a probability density function (gray filled curve).
Prospect chance of geological success is our current estimate of the likelihood that the success case geological model is correct. This does not necessarily equate to the chance of it encountering “enough reservoired oil or gas to sustain flow” (cf., Rose, 2001, p. 33) or to the chance of it being commercially developable.
Chance of success is referred to here as Pg following the terminology of Rose (1987, 1992, 2001); other sources use different terms and abbreviations such as probability of success-geological (POSg) (Ross, 1997, 2004; Quirk and Ruthrauff, 2008). Other sources refer to geological probability (GP), geological probability of success (GPoS), and chance of success (CoS).
The statement of the geological success case model should be intimately linked to the expression of the parameter ranges that the success case should deliver. These ranges are described in terms of probability exceedance distributions, Pn, which define the magnitude of a quantity for which there is considered to be an n% chance of the outcome exceeding that value (e.g., P50 corresponds to a 50% chance). Most commonly, when applying this to exploration prospects, we define an unrisked distribution, i.e., the P50 is the volume that we expect to exceed in 50% of the success case outcomes. The distribution of Pn vs. n defines a success case curve; Pg is the chance of getting on that curve.
We can state explicitly that the Pg is equivalent to the chance of exceeding the P100 hydrocarbon volume; it is also equivalent to twice the chance of exceeding the P50, 10 times the chance of exceeding the P10.
The term “risk” may cause confusion because it is used by some geoscientists as synonymous with Pg, whereas others use it to mean the chance of failure (1-Pg) and therefore, we recommend restricting use of the word to an informal, nonquantitative sense. Further potential confusion arises from a quite different usage of the term “risk” in the financial literature, for example, as used in discussion of efficient frontier models (Markowitz, 1959). Financial risk relates to the uncertainty on future investment returns, rather than the chance that there will be a return. It is commonly related to the historical volatility, determined by the standard deviation of the historical returns of a specific investment.
In petroleum exploration, uncertainty is distinct from, and largely independent of, the chance of success; it refers to the tightness of the range within which an estimated parameter may lie (e.g., Rose, 1987, 2001; Binns and Corbett, 2012). As shown in Figure 1, a high chance-of-success prospect may have high or low uncertainty. It is vital to have a clear understanding of the separation between risk and uncertainty. Uncertainty represents the possible range of values that a measurable quantity might have, for which we do not have the measurement today.
As we acquire additional knowledge about a prospect, we expect that the uncertainty should be progressively reduced, as our knowledge of each of the parameters becomes better constrained, so with increasing time and knowledge and data, we know which way we expect the uncertainty to move (it should have a tighter range, hence lower uncertainty). However, we should not expect the same of the chance of success: we do not know which way it will move. We expect that it probably will change, but by precisely how much, and in what direction, we cannot predict.
Because the Pg estimate is our opinion, based on the data and knowledge available to us at the time, and this changes with time, it is clear that Pg is an attribute of the observer’s state of knowledge, not an attribute of the subsurface geology. Unlike material properties such as porosity or gross rock volume, Pg is not a physically measurable quantity, and therefore it does not have an associated uncertainty. It is our opinion and our judgment at this moment, which in theory we know precisely. However, it will change as we gain new information. Our current estimate of Pg may be appropriate, given the information available to us, but it is not the “right answer” because there is no right answer. We might, today, judge the chance of success as being 0.35, and our peers may come to a similar estimate given the same information. However, if we had perfect knowledge, the chance of success would be zero (we know the prospect fails) or 1.0 (we know the prospect succeeds).
HOW INFORMATION CHANGES OUR ESTIMATE OF THE CHANCE OF SUCCESS OF A PROSPECT
Figure 2 shows how an initial Pg estimate, based on partial knowledge, may change with time as we obtain additional information. Each increase in knowledge causes us to change our estimate, but since we do not know in advance whether this will be changed for the better or for the worse, the distribution of where our future estimate could be increases in width from our current perspective. Figure 3A shows the change because of each increase in knowledge as binary in nature (only two possibilities, either good or bad) but the outcome may also be a distribution of intermediate outcomes (Figure 3B).
 Figure 2.
Schematic showing the progressive change of chance of success (Pg) estimate with time and five stages of increasing knowledge.
Figure 2.
Schematic showing the progressive change of chance of success (Pg) estimate with time and five stages of increasing knowledge.
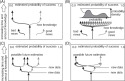 Figure 3.
Outcomes of acquiring new knowledge may be binary good/bad (A) or may fall on a continuous distribution (B). The inset in (B) represents a probability density function of the range of possible outcomes. A second piece of new knowledge may be independent of the first (C), or it may update and replace an existing piece of information (D).
Figure 3.
Outcomes of acquiring new knowledge may be binary good/bad (A) or may fall on a continuous distribution (B). The inset in (B) represents a probability density function of the range of possible outcomes. A second piece of new knowledge may be independent of the first (C), or it may update and replace an existing piece of information (D).
Another variant depends on whether the new information is a separate piece of information, complementary to and independent of the first, which does not replace the older information (Figure 3C), or whether the new information updates and replaces an older piece of information (Figure 3D). An example of two pieces of complementary (independent) information as shown in Figure 3C could be a seismic survey that informs the estimate of trap geometry, followed by a reservoir study that sheds light on the likelihood of reservoir presence. Because they are separate factors, these can give rise to four new outcomes. Commonly, the information on the fundamental components of prospect risk (such as source, reservoir, trap, and seal) might combine in this way. An example of a second piece of information updating or replacing an older one could be an assessment of the likelihood of trap geometry based on two-dimensional (2-D) seismic data, updated by information gained from a subsequent and overlapping three-dimensional (3-D) survey.
WHAT TO EXPECT WHEN EXPECTING: PRIOR PROBABILITY UPDATED BY SONIC REFLECTION DATA
We can learn about the process by comparing the prediction of prospect success or failure (i.e., estimating the Pg of a prospect) with the prediction of the gender of an unborn child. In both cases, we start off with minimal information, mostly based on global statistics; in both cases, we can gain additional knowledge as the prospect or baby matures, largely obtained by bouncing seismic waves off the hidden object, which enable us to progressively refine our estimate; and in both cases our estimate can be tested against the hidden reality, by birth or by drilling.
We have much better statistics on the prediction of fetal gender during pregnancy than we do on the prediction of prospect success prior to drilling. Additionally, we have better intuitive understanding of the process of prediction—we know that we cannot change the gender of the baby by carrying out an ultrasound examination, there is no question of increasing our chance of a girl by gaining new information. Yet is it surprisingly common in the petroleum industry to hear it suggested that we expect to de-risk prospects by acquiring 3-D data.
How we use words in common language can be very different from how we use the same words in formal science, and this can cause confusion when we use these words to discuss exploration risk. In common language, we “expect” an outcome that commonly occurs, such as the birth of a child (Murkoff and Mazel, 1984). It has a different meaning in probability and statistics, where the expectation is the predicted average outcome of an experiment (or process). The expected value is the sum of [(each of the possible outcomes) × (the probability of the outcome occurring)]. The expected value may not occur frequently, or may indeed never occur.
A classic study by Efrat et al. (1999) examined the changing reliability of fetal gender prediction in 172 singleton pregnancies at different ages of gestation. Our initial estimate of the likelihood of a baby girl, approximately 0.496, is based on global statistics (World Bank, 2011). Efrat et al. (1999) showed how ultrasound scans taken at 11, 12, and 13 weeks change in reliability, because the fetus develops. This is an example of updating or replacing information (Figure 3D) since a new scan would replace rather than augment the information from an older scan.
Figure 4, which is constructed from the data provided by Efrat et al., illustrates graphically how our estimate of fetal gender could be modified by the acquisition of three successive sets of new information, provided by ultrasound scans.
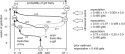 Figure 4.
Changing reliability and probability of the estimate of fetal gender, based on ultrasound scans. This chart was created from statistical data provided in Efrat et al. (1999). Numbers shown in the chart represent the number fraction of the total sample. Open circles represent probability values for the prior estimate and for estimates revised after ultrasound scanning.
Figure 4.
Changing reliability and probability of the estimate of fetal gender, based on ultrasound scans. This chart was created from statistical data provided in Efrat et al. (1999). Numbers shown in the chart represent the number fraction of the total sample. Open circles represent probability values for the prior estimate and for estimates revised after ultrasound scanning.
The initial estimate of the chance of a girl is 0.496. Combining this with the data of Efrat et al. allows us to calculate the full tree of possible outcomes. The 11-week scan is of low reliability with more cases identified as likely female (approximately 75% of results) giving a predicted chance of female of 0.625, and fewer cases identified as likely male (approximately 25%) but with a higher reliability (chance of male if identified as male, approximately 90%). The expected number of females after the 11-week scan is 0.75 × 0.625 + 0.25 × 0.9 = 0.496; this is unchanged from the initial estimate. Similarly, as the reliability of the diagnosis increases, the confidence that we can assign to each outcome improves, but the total expected number of females is unchanged. There is no intuitive surprise to this because we know that ultrasound scanning cannot change fetal gender.
We can apply exactly the same type of analysis to the evolution of our estimate of prospect risk, which changes as we acquire new information. All such processes are governed by the same mathematical relationship, known as the law of total probability.
THE LAW OF TOTAL PROBABILITY AND ITS IMPLICATION FOR PROSPECT RISK
The law of total probability (see, e.g., Cyganowski et al., 2002) goes back to the roots of modern probability theory, although it is unclear where it was first formulated. Salkind (2010) noted that it is implicit to Bayes’ theorem (Bayes, 1763) and the theory of inverse probability (Laplace, 1774). It is a mathematical statement of the principle that was demonstrated by the study of fetal gender prediction: the mean outcome—the expected value of the probability of an event, after we have the new information—is equivalent to the prior probability, assessed before we have the information. The law can be expressed as P(B)  where P(B) is our prior probability of an event B (for prospect Pg, event B is that a prospect is a success). An event A (which could be the acquisition of new information, such as 3-D seismic data) can have n possible outcomes. Each outcome has its own likelihood of occurring, P(Ai), and each causes us to revise our estimation of the chance of a discovery (P(B|Ai).
For a piece of information with a simple, binary outcome, as shown in Figure 5, the law simplifies to: prior probability,  = expected value of probability after new information.
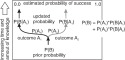 Figure 5.
The law of total probability applied to a single binary outcome.
Figure 5.
The law of total probability applied to a single binary outcome.
In informal language, this is equivalent to rule (1) of Peel and White (in press): “You should not expect to improve Pg by acquiring new data. Some prospects will see improved Pg, some will become worse, but the expected value of Pg (the average of all possible outcomes) will be unchanged.”
WHY WE EXPECT MOST PROSPECTS TO GET WORSE WITH INCREASED INFORMATION
Exploration prospects commonly have a chance of success significantly below 0.5; the examples shown by Quirk and Ruthrauff (2008) documented 18 oil and gas exploration plays, for which the overall mean Pg was ca. 0.35, with average Pg for the individual plays ranging from 0.2 to 0.48.
For most—but not all—types of information, we expect that if the prior Pg is less than 0.5, there should be more outcomes for which Pg is lowered than those for which Pg is raised. This depends on the nature of the information, in particular how strongly diagnostic it is, and whether the new information results in a symmetric or asymmetric posterior value Pg, as shown in Figure 6. The diagnostic strength measures the difference in revised probability between the good news and bad news outcomes. Symmetry of outcome measures whether the Pg given good news is equal to the chance of failure (1-Pg), given bad news (e.g., positive news updates Pg to 0.9, negative news updates it to 0.1).
 Figure 6.
The effect of new information on the estimated chance of success (Pg) depends on the type of information: whether the outcome is symmetric (A–C) or asymmetric (D–F), and how strongly diagnostic it is (A = fully diagnostic; B and D = strongly diagnostic; C and E = moderately diagnostic; F = weakly diagnostic).
Figure 6.
The effect of new information on the estimated chance of success (Pg) depends on the type of information: whether the outcome is symmetric (A–C) or asymmetric (D–F), and how strongly diagnostic it is (A = fully diagnostic; B and D = strongly diagnostic; C and E = moderately diagnostic; F = weakly diagnostic).
Fully Diagnostic Information
If the information is very strongly diagnostic of likely success or failure, giving revised probability close to 0 and 1, the proportion of outcomes with raised Pg is equal to the prior Pg. For typical prospects with prior Pg < 0.5, we expect fully diagnostic information to downgrade more than half of the outcomes (Figure 6A). For example, if prior Pg = 0.35, we expect fully diagnostic information to downgrade 65% of the outcomes (Figure 6A), but the mean of the outcomes is unchanged at 0.35.
Symmetrically Diagnostic Information
If the new information is symmetrically diagnostic and prior Pg < 0.5, we also expect more downgrades than upgrades (Figure 6B), but the mean of the outcomes is unchanged.
Asymmetrically Diagnostic Information
Some types of new information create an asymmetric outcome, and some of these may result in more outcomes being upgraded than those that are downgraded. For example, sparse 2-D seismic data may be sufficient to reveal that a trap does not have a valid closure, giving updated probability of 0.1 or less, but the same data might not be capable of demonstrating that the trap definitely does close, so it cannot boost trap likelihood to 0.9. If the asymmetry is skewed to the downside, the law of total probability dictates that the number of outcomes should be skewed toward the upside to match. In the example with prior Pg of 0.35, a piece of information with possible outcomes 0.1 (if bad news) or 0.5 (if good news) would imply that 63% of outcomes should see upgraded Pg (Figure 6C); but the mean of the outcomes is unchanged at 0.35.
This simple analysis demonstrates that for most types of information we can expect to receive, and for a prospect with initial Pg less than 0.5, we should expect that, more often than not, new work and new information will cause our Pg estimate to be lowered. This is not a universal rule; for some information types that have strongly asymmetric results that can condemn more effectively than they can prove in favor, we should expect more upgrade outcomes than downgrade outcomes. For the fortunate few exploration prospects with Pg > 0.5, the converse is true and we expect new information to upgrade Pg more commonly than it downgrades—with the same proviso about asymmetry.
In informal language, this is equivalent to rule (2) of Peel and White (in press): “you should expect Pg to become worse for the majority of prospects.”
APPLICATION TO A SIMULATED PROSPECT
It would be instructive to create a study of the progressive evolution of estimated Pg of real prospects, based on successive information, comparable to the fetal gender study, using real examples. However, this is not possible, because to do so we would have to gain information on hundreds of near-identical prospects, studied in near-identical sequence using near-identical methods. We would also require access to a complete historical record showing the progressive evolution of the Pg estimate for each prospect. However, all prospects are different, the nature of the information we gain is different in each prospect, and there is no data set tracking the evolution of Pg estimates. It is, however, possible to take one prospect (in this case, a synthetic one) and to examine all the possible outcomes of the different types of information and their impact on Pg estimates. We recognize that this synthetic prospect is artificial, and we do not claim that this is representative of all real-world prospects; however, it represents a typical prospect based on the authors’ experience of hundreds of geological prospects across different exploration companies, and the results serve to inform our understanding of how Pg is expected to change in real-world examples.
Our example has an initially estimated Pg of 0.25, obtained by multiplication of the chance of four independent prospect risk components: reservoir (prior chance 0.72), seal (prior chance 0.5), trap (prior chance 0.86), and source (prior chance 0.81). We plan to gain information on each of these components, and can model the possible outcomes of each piece of information. For each component, for the purpose of this model we have estimated how the component chance will be modified in the event of good news or bad news, plus the chance of a good or a bad outcome (Figure 7A). Each of the component estimates shown in Figure 7A is consistent with the law of total probability; thus for each component, the weighted average of the updated (conditional) probabilities is equal to the prior probability for that component. The way in which the prior component chance is updated by new information is based on real examples. To take the example of the source component (which considers source presence, richness, maturity, expulsion, migration, etc.), we considered the impact of information gained in the form of seabed drop-coring. Detection of oil seeps at surface is strongly indicative of a working source system, with migration from source up past the prospect to sea floor, so a positive outcome from the coring program updates our perceived chance of a working source system to near-proven (0.99). However, a negative result in the drop-core program is suggestive, but not condemnatory (there are many reasons why seeps may not be detected) and the downward-revised outcome is not as severe (0.4).
 Figure 7.
Results of simulating the progressive maturation of a prospect, in which information is gained on each of four independent risk components. Pg = chance of success.
Figure 7.
Results of simulating the progressive maturation of a prospect, in which information is gained on each of four independent risk components. Pg = chance of success.
The calculated possible outcomes are shown in Figure 7B–E. The crossplots show how the estimate of overall Pg changes from its initial value of 0.25 as information is gained, in succession, on the four components.
The first piece of information gained will resolve some issues regarding the reservoir (Figure 7B). There are two classes of outcome relative to the original estimate, with 0.7 of the outcomes seeing upgraded Pg and 0.3 seeing downgraded Pg. For this change, the effect of the asymmetry of the information (Figure 7A) outweighs the effect of having original Pg < 0.5, resulting in more upgrade outcomes than downgrade outcomes. But the expected value (the mean of all outcomes) remains unchanged at a value of 0.25.
As more pieces of information are gathered, the effect of having original Pg < 0.5 outweighs the effect of any information asymmetry, and the number of downgraded outcomes inexorably increases. When we gain information on seal, the likelihood that an individual outcome is upgraded from the original Pg estimate goes down to 0.35, and the next information on trap reduces this likelihood to 0.33. However, in every case the expected value (mean of all the outcomes) is unchanged.
This calculation exercise is informative: it provides a good demonstration that the law of total probability does indeed apply to a typical work plan for a typical exploration prospect. The new information causes us to change our Pg estimate progressively, but the expected value of the new Pg (the mean of all possible outcomes) is unchanged. The exercise conforms to the two rules of Peel and White (in press).
The more pieces of information we acquire, the more likely it is that the outcome has lower Pg than the prior value (but the average of those outcomes remains constant).
PLAYS AND GROUPS OF PROSPECTS WITH RISK DEPENDENCY
Discussion so far in this paper has focused on an individual prospect. A portfolio of prospects may be fully independent, or the prospects may have a degree of dependency, so that information that changes our estimate of Pg of one prospect affects the whole group. For a suite of prospects in an unproven hydrocarbon play, we may be able to separate out a play risk that applies equally to all prospects in the group (White, 1993). The law of total probability applies equally to dependent groups and plays; new data may allow us to change the play risk, but we do not know whether the new data will make it better or worse, and the mean of all possible outcomes is, as before, zero net change.
MANAGING A PORTFOLIO OF PROSPECTS (CHANGING THE AVERAGE CHANCE OF SUCCESS BY SELECTIVE CULLING AND NEW PROSPECT IDENTIFICATION)
Although the arguments made previously can be rigorously justified for a portfolio consisting of a static group of already-identified opportunities, real-world conditions commonly make it possible to change the average chance of success of an actual portfolio by adding new prospects and culling low-ranking ones. In a “free market” of prospects, in which we have no drilling commitments and are free to choose which to drill and which to cull, this can result in significant value addition. If we initially had 10 prospects in a lease area, each of the type described in shown in Figure 7, with initial Pg of 0.25, we would expect after gaining additional information to have some looking better (higher Pg) and some worse (lower Pg). If the forward model is representative of the prospects, the most likely outcome is to end up with two prospects raised to about Pg = 0.7, one raised to Pg = 0.3, one near-unchanged at Pg = 0.24, and the rest with significantly lowered Pg values < 0.15. The average Pg of the portfolio is unchanged at 0.25, and the expected number of successes, if we drill all of them, is unchanged at 2.5 successes.
If we can cull the prospects that now appear less attractive, with a culling threshold of Pg = 0.2, we are left with four survivors, whose average Pg is raised to about 0.5.
The new information has potentially added value, not by increasing the number of expected successes (which has, in fact, fallen slightly, to 2.2) but by eliminating the cost of drilling the six culled prospects, which are likely to be failures. Depending on the exploration maturity of the lease area, it may be possible to replace the culled prospects by identifying new ones with which to refresh the portfolio.
However, this method of improving average Pg by culling and introducing new prospects does not apply in settings where there is no optionality (e.g., where the terms of the lease dictate a fixed set of commitment wells, and no new opportunities can be identified and substituted).
DISCUSSION
Although we cannot and should not expect to de-risk prospects by gaining new knowledge about them, there is clearly real value to having new knowledge. The increase in value does not arise from an increase in the expected number of successes from an established prospect portfolio, nor from an expectation of increasing the risked prospective resource. The VoI lies in the ability to make decisions using that information: VoI theory is abundantly documented elsewhere (Howard, 1966; Howard and Matheson, 1981; Coopersmith and Cunningham, 2002; Coopersmith et al., 2006; for a review of VoI literature, see Bratvold and Begg, 2008, 2010; Bratvold et al., 2009), and it is not the purpose of this paper to restate VoI theory. For a portfolio of existing prospects, the principal increase in full-cycle value comes from deciding which prospects not to drill, thereby saving the cost of a likely dry hole: increasing the estimated Pg of a prospect which was due to be drilled in any case has no value, because it did not change any decision. Value is also added if valid new information raises the estimated Pg of an existing prospect that previously had not been a drill-worthy candidate, leading to it being promoted from nondrill to drill. The identification of dependency groups (prospects which have a component of shared risk, so that information gained on one prospect may affect the Pg estimate of the whole group) allows the VoI to be maximized.
Other sources of real value derived from the new knowledge may include identification of new concepts, new plays, and new prospects.
As well as giving us a better understanding of how and why prospect Pg changes with increased knowledge, awareness of the basic principles informs our day-to-day activities, for example:
- It may be unwise to enter a performance contract that includes a commitment to improve Pg of a prospect or prospect portfolio (unless the prior Pg > 0.5, this is likely to lead to failure); good work done well may lead to a more reliable Pg estimate, but it is more likely to be a reduced Pg estimate.
- Pay attention if a team is working on a large group of prospects, and they all apparently improve in Pg. Although the expected value of the average Pg change is zero, it is unlikely to be exactly zero, and the overall change could be positive or negative; but a major shift needs to be explained. It may be that the prospects all fall within a dependency group, and that the shared risk has changed (note that shared risk may go up or down); it may be the luck of the draw. But a persistent, year-on-year improvement in Pg across a large number of prospects may be an indicator of nongeological influences.
- If a prospect-risking method automatically penalizes a prospect for not having certain data types (e.g., deducts Pg points if there is only 2-D seismic data), or automatically rewards it for other activities, the risking method should be considered suspect.
CONCLUSIONS
Undrilled prospects and unborn children are subject to the same laws of probability; in both cases, we have an unknown outcome, and we acquire information of progressively increasing reliability to improve our estimate of the chance of the outcome. But we do not expect gaining information on the gender of a fetus to change its gender, and we should not expect acquisition of new information to de-risk a prospect.
It is possible to derive meaningful statistics for a situation like prenatal screening because the same process is carried out on multiple, repeatable test cases, with the same prior probabilities; but to do so for real exploration prospects is impractical because each prospect is different, with different prior probabilities and different information acquired. However, we can use exploration experience to create a synthetic prospect which can be fully analyzed in a repeatable way. The results of this analysis are consistent with the theoretical predictions.
The expected value of Pg after gaining new information is unchanged: the actual value may be increased or decreased, but the mean of all possible outcomes is no change.
Given the nature of real-world geological prospects (typical Pg < 0.5), and the nature of the information we typically gain about them prior to drilling, we expect that a majority of prospects will suffer reduced Pg given new information, but the minority that improve do so by a greater amount than the majority that become worse, so the average outcome is unchanged.
REFERENCES CITED
Allais, M., 1956, Évaluation des Perspectives Économiques de la Recherche Minière sur de Grands Espaces—Application au Sahara Algérien (in French): Revue de l’Industrie Minérale, v. 1, p. 329–383.
Bayes, T., 1763, An essay toward solving a problem in the doctrine of chances: Philosophical Transactions of the Royal Society of London, v. 53, p. 370–418, doi:10.1098/rstl.1763.0053.
Bender, A. A., I. Bryant, R. Chhibber, T. Campbell, A. Lovatini, E. Mavridou, and D. B. Palmowski, et al., 2010, Integrating exploration tools to reduce risk: Oilfield Review, v. 22, no. 2, p. 4–13.
Binns, P., and P. Corbett, 2012, Risk and uncertainty from frontier to production—A review: First Break, v. 30, no. 1830, p. 41–48, doi:10.3997/1365-2397.2012006.
Bratvold, R. B., and S. H. Begg, 2008, I would rather be vaguely right than precisely wrong: A new approach to decision making in the petroleum exploration and production industry: AAPG Bulletin, v. 92, no. 10, p. 1373–1392, doi:10.1306/06040808070.
Bratvold, R. B., and S. H. Begg, 2010, Making good decisions: Dallas, Texas, SPE, 207 p.
Bratvold, R. B., E. J. Bickel, and H. P. Lohne, 2009, Value of information in the oil and gas industry: Past, present, and future: SPE Reservoir Evaluation and Engineering, v. 12, no. 4, p. 630–638, doi:10.2118/110378-PA.
Coopersmith, E. M., M. Burkholder, and J. Schluze, 2006, Value-of-information lookbacks—Was the information you gathered really worth getting?: SPE Annual Technical Conference and Exhibition, San Antonio, Texas, September 24–27, 2006, SPE Paper 101540, 7 p., doi:10.2118/101540-MS.
Coopersmith, E. M., and P. C. Cunningham, 2002, A practical approach to evaluating the value of information and real option decisions in the upstream petroleum industry: SPE Annual Technical Conference and Exhibition, San Antonio, Texas, September 29–October 2, 2002, SPE Paper 77582, 10 p., doi:10.2118/77582-MS.
Cyganowski, S., P. Kloeden, and J. Ombach, 2002, From elementary probability to stochastic differential equations with MAPLE®: Berlin, Springer, 310 p.
Divi, R. S., 2004, Probabilistic methods in petroleum resource assessment, with some examples using data from the Arabian region: Journal of Petroleum Science and Engineering, v. 42, no. 2–4, p. 95–106, doi:10.1016/j.petrol.2003.12.003.
Duff, B. A., and D. Hall, 1996, A model-based approach to evaluation of exploration opportunities, in A. G. Dore, and R. Sinding-Larsen, eds., Quantification and prediction of petroleum resources: Norwegian Petroleum Society (NPF) Special Publication 6, p. 183–198.
Efrat, Z., O. O. Akinfenwa, and K. H. Nicolaides, 1999, First-trimester determination of fetal gender by ultrasound: Ultrasound in Obstetrics and Gynecology, v. 13, no. 5, p. 305–307, doi:10.1046/j.1469-0705.1999.13050305.x.
Geological Society of London, 2014, Reducing subsurface uncertainty and risk through field-based studies—The value of outcrops and analogues in hydrocarbon exploration, development and production implications for global exploration and production, Burlington House, Piccadilly, London, March 4–8, 2014, The Geological Society, accessed August 17, 2015, https://www.geolsoc.org.uk/~/media/shared/documents/specialist%20and%20regional%20groups/petroleum/Field%20Studies%20PG%20Poster_1.ashx.
Geological Society of Norway, 2015, Recent advances in exploration technology and NCS prospect fair; identify opportunities—Reduce risk, Oslo, Norway, May 20–21, 2015, Geological Society of Norway, accessed August 17, 2015, http://www.ncs-exploration.com/.
Howard, R. A., 1966, Information value theory: IEEE Transactions on Systems Science and Cybernetics (SSC-2), v. 2, no. 1, p. 22–26, doi:10.1109/TSSC.1966.300074.
Howard, R. A., and J. E. Matheson, 1981, Influence diagrams, in R. A. Howard, and J. E. Matheson, eds., Readings on the principles and applications of decision analysis: Menlo Park, California, Strategic Decisions Group, v. 2, p. 719–762.
Kaufman, G. M., 1996, Risk analysis: From prospect to exploration portfolio and back, in A. G. Dore, and R. Sinding-Larsen, eds., Quantification and prediction of petroleum resources: Norwegian Petroleum Society (NPF) Special Publication 6, p. 135–152.
Laplace, P. S., 1774, Mémoire sur la probabilité des causes par les événements (in French): Mémoires de l’Académie Royale des Sciences de Paris, Tome VI, p. 621–656.
Markowitz, H. M., 1959, Portfolio selection: Efficient diversification of investments: New York, John Wiley & Sons, 400 p. (reprinted by Yale University Press, 1970, ISBN 978-0-300-01372-6; 2nd edition, Basil Blackwell, 1991, ISBN 978-1-55786-108-5).
Megill, R. E., 1977, An introduction to exploration risk analysis: Tulsa, Oklahoma, PennWell, 273 p.
Murkoff, H. E., and S. Mazel, 1984, What to expect when you’re expecting, 1st edition: New York, Workman Publishing Company, 351 p.
Newendorp, P. D., 1971, Bayesian analysis—A method for updating risk estimates: Journal of Petroleum Technology, v. 24, no. 2, p. 193–198, doi:10.2118/3463-PA.
Newendorp, P. D., 1975, Decision analysis for petroleum exploration, 1st edition: Tulsa, Oklahoma, PennWell, 668 p.
Peel, F. J., and J. White, in press, Do technical studies reduce subsurface risk in hydrocarbon exploration—And if not, how do they add value?, in P. Hirst, and M. Bowman, eds., The value of outcrop studies in reducing subsurface uncertainty and risk in hydrocarbon exploration, development and production: Geological Society, London, Special Publications.
Quirk, D. G., and R. G. Ruthrauff, 2008, Toward consistency in petroleum exploration: A systematic way of constraining uncertainty in prospect volumetrics: AAPG Bulletin, v. 92, no. 10, p. 1263–1291, doi:10.1306/06040808064.
Rose, P. R., 1987, Dealing with risk and uncertainty in exploration: How can we improve?: AAPG Bulletin, v. 71, no. 1, p. 1–16.
Rose, P. R., 1992, Chance of success and its use in petroleum exploration, in R. Steinmetz, ed., The business of petroleum exploration: Handbook of petroleum geology: AAPG Treatise of Petroleum Geology, p. 71–86.
Rose, P. R., 2001, Risk analysis and management of petroleum exploration ventures: AAPG Methods in Exploration 12, 178 p.
Ross, J. G., 1997, The philosophy of reserve estimation: SPE Hydrocarbon Economics and Evaluation Symposium, Dallas, Texas, March 16–18, 1997, SPE Paper 37960, 7 p., doi:10.2118/37960-MS.
Ross, J. G., 2004, Risk and uncertainty in portfolio characterisation: Journal of Petroleum Science and Engineering, v. 44, no. 1–2, p. 41–53, doi:10.1016/j.petrol.2004.02.004.
Russell, B., 1946, A history of western philosophy: London, United Kingdom, George Allen & Unwin Ltd., 778 p.
N. J. Salkind, ed., 2010, Encyclopedia of research design: Thousand Oaks, California, Sage Publications, Inc., v. 1, 1776 p., doi:10.4135/9781412961288.
Smith, A., 1776, An inquiry into the nature and causes of the wealth of nations: London, United Kingdom, Strahan and Cadell, 1097 p.
White, D. A., 1993, Geologic risking guide for prospects and plays: AAPG Bulletin, v. 77, p. 2048–2064.
World Bank, 2011, World Bank Database on Gender Statistics, 2011, accessed August 17, 2015, http://datatopics.worldbank.org/gender/.
AUTHORS
Frank J. Peel received his doctoral degree from the University of Oxford. He was a structural geologist and senior technical adviser at BP and BHP from 1985 to 2013. He joined the National Oceanography Centre in 2013. His research interests include salt tectonics, gravity-driven deformation, fluid flow, and exploration risk. He is a recipient of the AAPG’s Matson Award.
John R. V. Brooks received his doctoral degree from the University of Kingston. As director of exploration and licensing of the UK DoE, he was responsible for regulating UK petroleum licensing rounds. His company, Brookwood Petroleum, provides advice to international governments establishing petroleum licensing rounds, and as senior visiting research fellow, he mentors students at Southampton. He is a former president, European Region AAPG.
ACKNOWLEDGEMENTS
The authors gratefully acknowledge support for Frank Peel by NERC, the UK Natural Environment Research Council, through National Capability Funding. Incisive reviews provided by Stephen Greenlee and James Handschy contributed greatly to the improvement of this paper. Consulting editor Frances Plants Whitehurst gave input on several technical and editorial issues, which led to considerable further improvement. David Labonte provided us with modern references to the law of total probability. Frank J. Peel and his daughter give personal thanks to Kypros Nicolaides for the expert prenatal diagnosis that inspired this paper.