The AAPG/Datapages Combined Publications Database
AAPG Bulletin
Figure
AAPG Bulletin; Year: 2015; Issue: December DOI: 10.1306/070615045
Return to Full Text
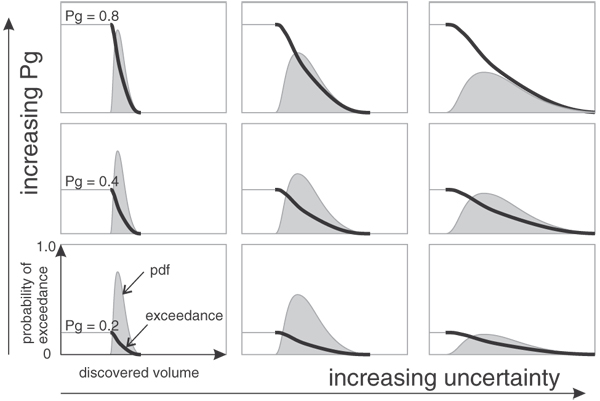
Figure 1. The difference between chance of success (risk) (Pg) and confidence for a prospect. Increasing uncertainty is reflected by a broadening of the error range on the predicted success case volume, which is represented by an exceedance curve (black) and by a probability density function (gray filled curve).
Figure 1. The difference between chance of success (risk) (Pg) and confidence for a prospect. Increasing uncertainty is reflected by a broadening of the error range on the predicted success case volume, which is represented by an exceedance curve (black) and by a probability density function (gray filled curve).