The AAPG/Datapages Combined Publications Database
AAPG Bulletin
Figure
AAPG Bulletin; Year: 2016; Issue: February DOI: 10.1306/08171514211
Return to Full Text

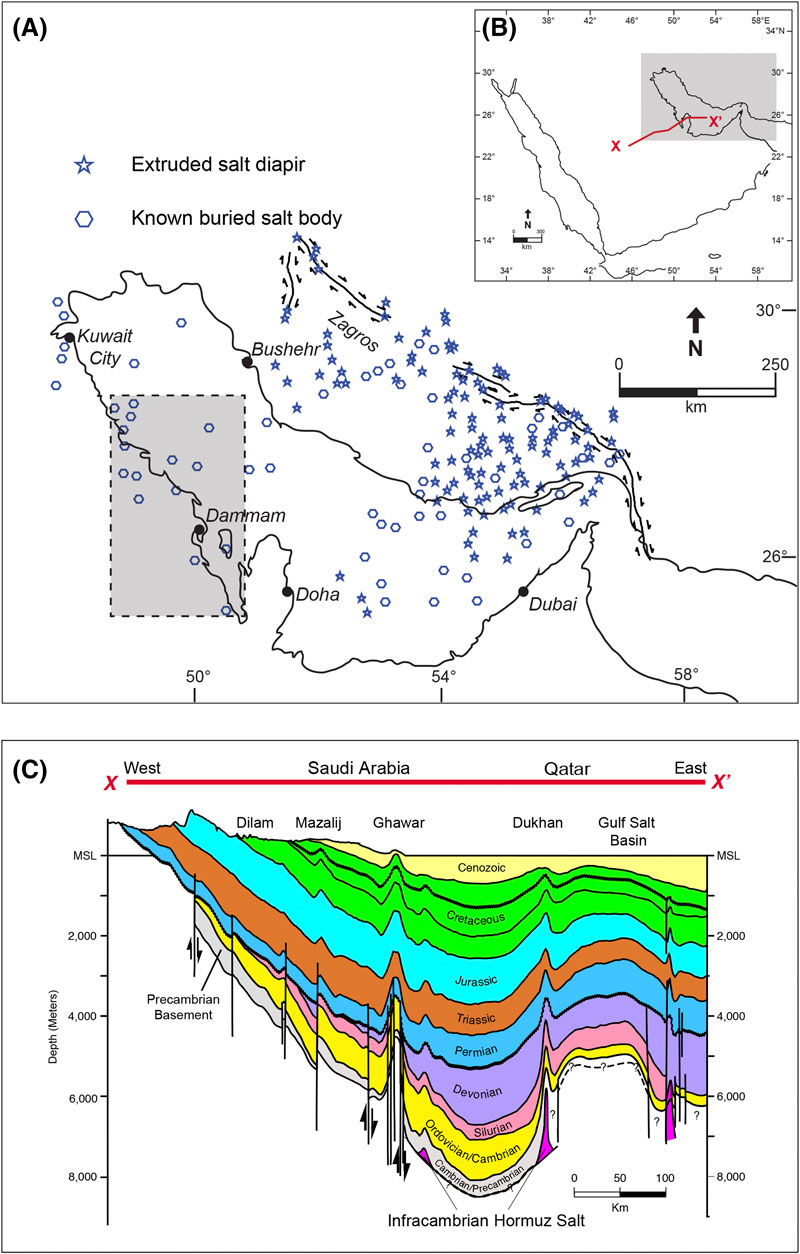
Figure 1. (A) Regional map of the Persian Gulf region and the Hormuz salt distributions, modified after Bahroudi and Koyi (2003). The location of the study area is highlighted in the dashed square. (B) Index map highlights location of the Gulf region and the geologic traverse in Figure 1C. (C) Geologic traverse (XX′) shows the sedimentary successions above Hormuz salt, modified from Konert et al. (2001), courtesy of GeoArabia, and after Alsharhan and Nairn (1997).

Figure 1. (A) Regional map of the Persian Gulf region and the Hormuz salt distributions, modified after Bahroudi and Koyi (2003). The location of the study area is highlighted in the dashed square. (B) Index map highlights location of the Gulf region and the geologic traverse in Figure 1C. (C) Geologic traverse (XX′) shows the sedimentary successions above Hormuz salt, modified from Konert et al. (2001), courtesy of GeoArabia, and after Alsharhan and Nairn (1997).