The AAPG/Datapages Combined Publications Database
AAPG Bulletin
Figure
AAPG Bulletin; Year: 2016; Issue: February DOI: 10.1306/08171514211
Return to Full Text
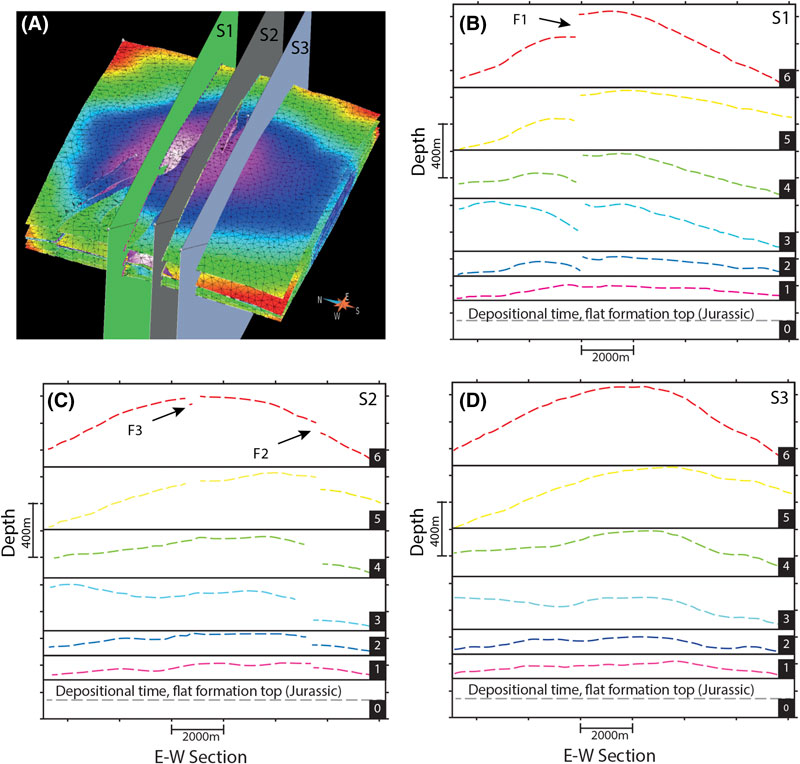
Figure 5. Evolution of the dome structure from the top of unit F. (A) View for the locations of cross sections (B) S1, (C) S2, and (D) S3. Profiles display dome geometry at relative geologic times as follows: 6 = present time, 5 = 89 Ma, 4 = 112 Ma, 3 = 136 Ma, 2 = 141 Ma, and 1 = 154 Ma. F1, F2, and F3 are labels for faults 1, 2, and 3, respectively (see Figure 6).
Figure 5. Evolution of the dome structure from the top of unit F. (A) View for the locations of cross sections (B) S1, (C) S2, and (D) S3. Profiles display dome geometry at relative geologic times as follows: 6 = present time, 5 = 89 Ma, 4 = 112 Ma, 3 = 136 Ma, 2 = 141 Ma, and 1 = 154 Ma. F1, F2, and F3 are labels for faults 1, 2, and 3, respectively (see Figure 6).