The AAPG/Datapages Combined Publications Database
AAPG Bulletin
Figure
AAPG Bulletin; Year: 2016; Issue: February DOI: 10.1306/08171514211
Return to Full Text
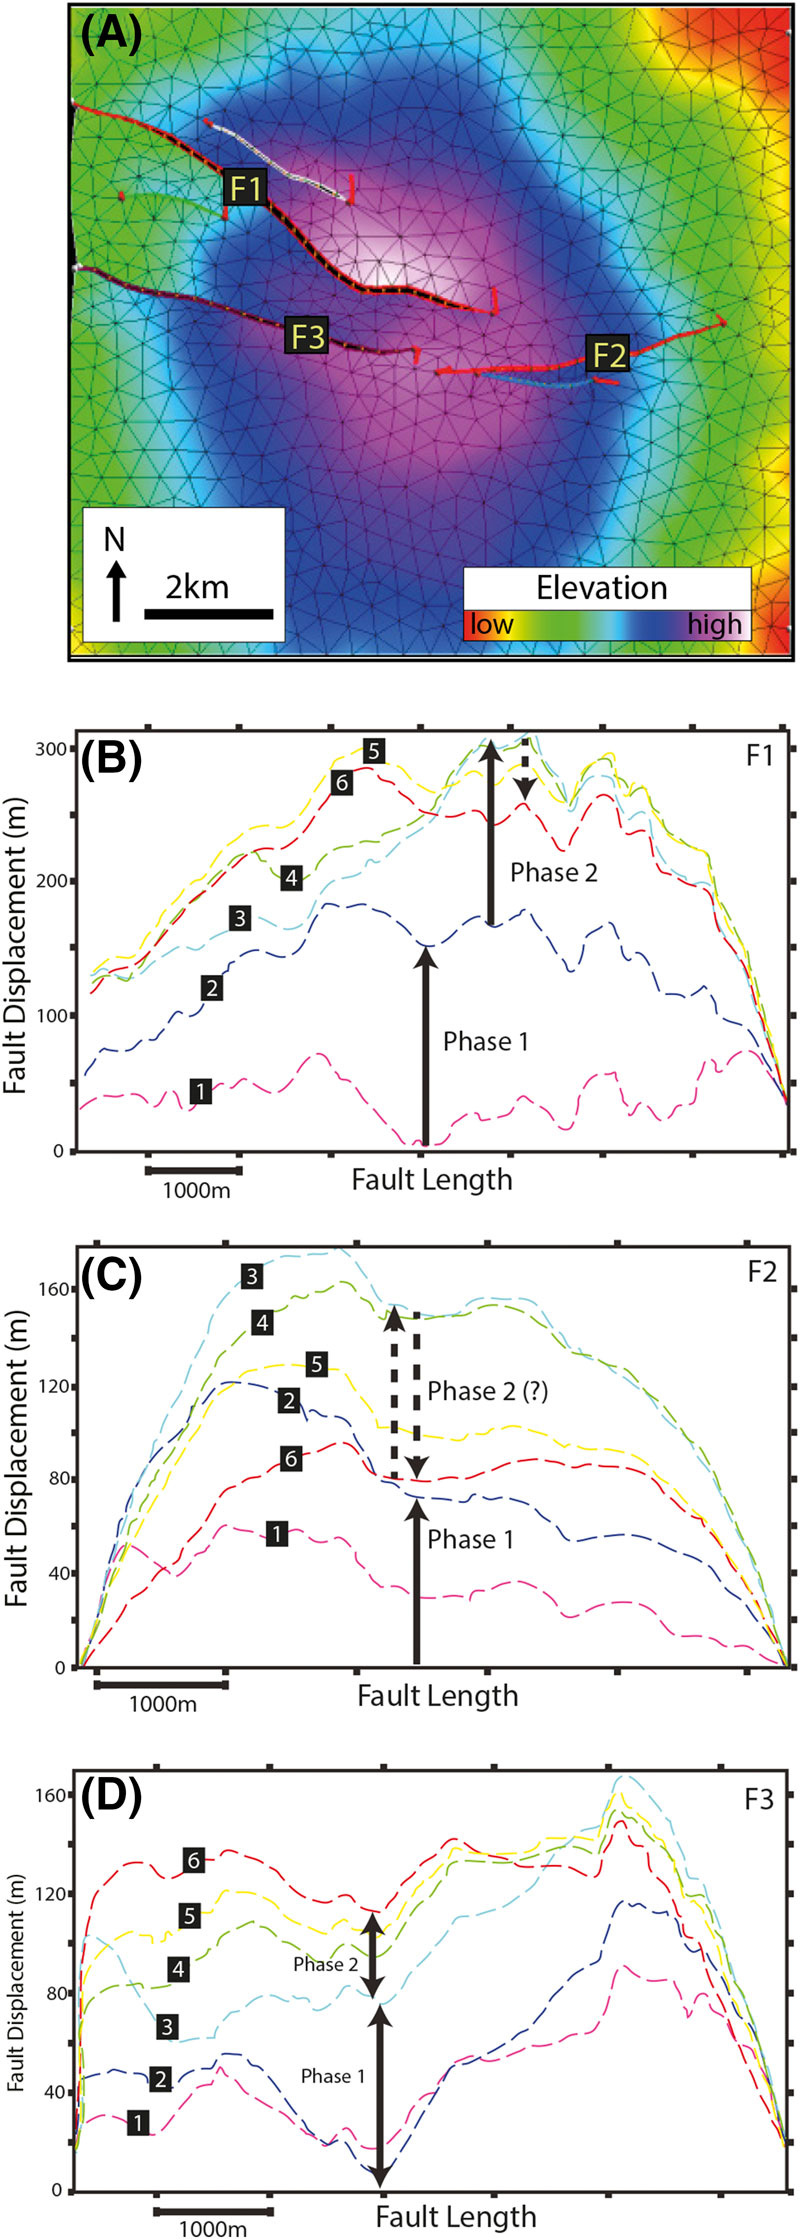
Figure 6. Evolution of faults computed from the three-dimensional sequential restorations. (A) Map view of the faults. The displacement profiles of faults (B) F1, (C) F2, and (D) F3. Profiles are numbered to indicate deformation stages 6, 5, 4, 3, 2, and 1 obtained from the restorations of units A, B, C, D, E, and F, respectively. Profiles show fault displacements at relative geologic times as follows: 6 = present time, 5 = 89 Ma, 4 = 112 Ma, 3 = 136 Ma, 2 = 141 Ma, and 1 = 154 Ma. The fault profiles were produced by defining points (at nodes of tetrahedra) along the faults corresponding to the cutoffs of unit F that were displaced through restoration (Figure 5A). Mirrored points are connected via lines (vectors) parallel to the fault planes, such that these vectors equal the fault displacements after each restoration step.
Figure 6. Evolution of faults computed from the three-dimensional sequential restorations. (A) Map view of the faults. The displacement profiles of faults (B) F1, (C) F2, and (D) F3. Profiles are numbered to indicate deformation stages 6, 5, 4, 3, 2, and 1 obtained from the restorations of units A, B, C, D, E, and F, respectively. Profiles show fault displacements at relative geologic times as follows: 6 = present time, 5 = 89 Ma, 4 = 112 Ma, 3 = 136 Ma, 2 = 141 Ma, and 1 = 154 Ma. The fault profiles were produced by defining points (at nodes of tetrahedra) along the faults corresponding to the cutoffs of unit F that were displaced through restoration (Figure 5A). Mirrored points are connected via lines (vectors) parallel to the fault planes, such that these vectors equal the fault displacements after each restoration step.