The AAPG/Datapages Combined Publications Database
AAPG Bulletin
Figure
AAPG Bulletin; Year: 2016; Issue: March DOI: 10.1306/12111514166
Return to Full Text
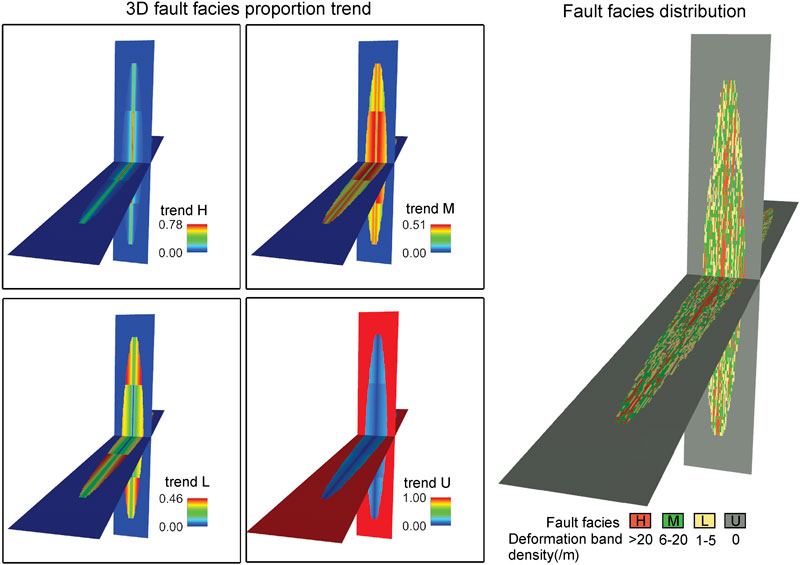
Figure 10. Three-dimensional (3-D) facies proportion trend and an example of the resulting facies distribution after running the model. Facies H = deformation band density >20/m (/3.28 ft); facies M = deformation band density 6–20/m (/3.28 ft); facies L = deformation band density 1–5/m (/3.28 ft); facies U = undeformed rock.
Figure 10. Three-dimensional (3-D) facies proportion trend and an example of the resulting facies distribution after running the model. Facies H = deformation band density >20/m (/3.28 ft); facies M = deformation band density 6–20/m (/3.28 ft); facies L = deformation band density 1–5/m (/3.28 ft); facies U = undeformed rock.