The AAPG/Datapages Combined Publications Database
AAPG Bulletin
Figure
AAPG Bulletin; Year: 2016; Issue: March DOI: 10.1306/12111514166
Return to Full Text

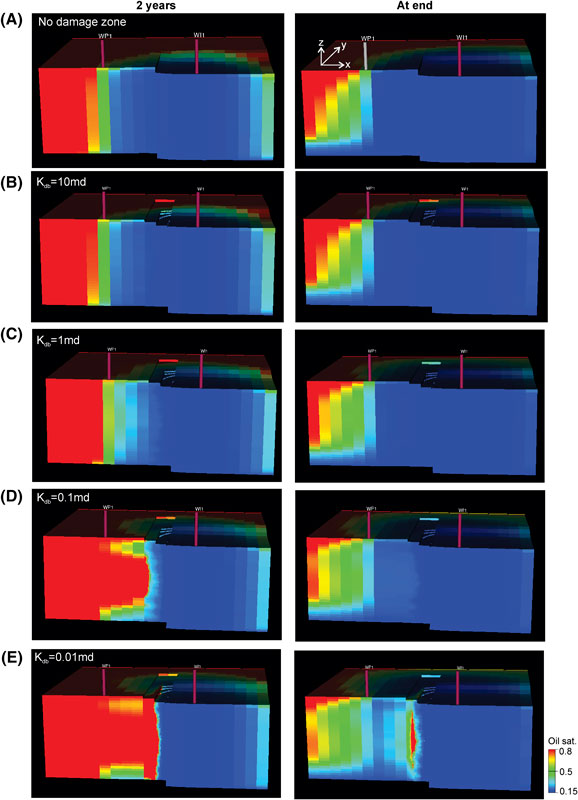
Figure 17. Cross-section view of (A) oil saturation after 2 yr of water injection and oil saturation at the end in a reservoir model without damage zone and reservoir models containing damage zones with deformation band permeability of (B) 10 md, (C) 1 md, (D) 0.1 md, and (E) 0.01 md. Injector is on the right side, and producer is on the left side. Oil sat. = oil saturation.

Figure 17. Cross-section view of (A) oil saturation after 2 yr of water injection and oil saturation at the end in a reservoir model without damage zone and reservoir models containing damage zones with deformation band permeability of (B) 10 md, (C) 1 md, (D) 0.1 md, and (E) 0.01 md. Injector is on the right side, and producer is on the left side. Oil sat. = oil saturation.