The AAPG/Datapages Combined Publications Database
AAPG Bulletin
Figure
AAPG Bulletin; Year: 2016; Issue: March DOI: 10.1306/12111514166
Return to Full Text
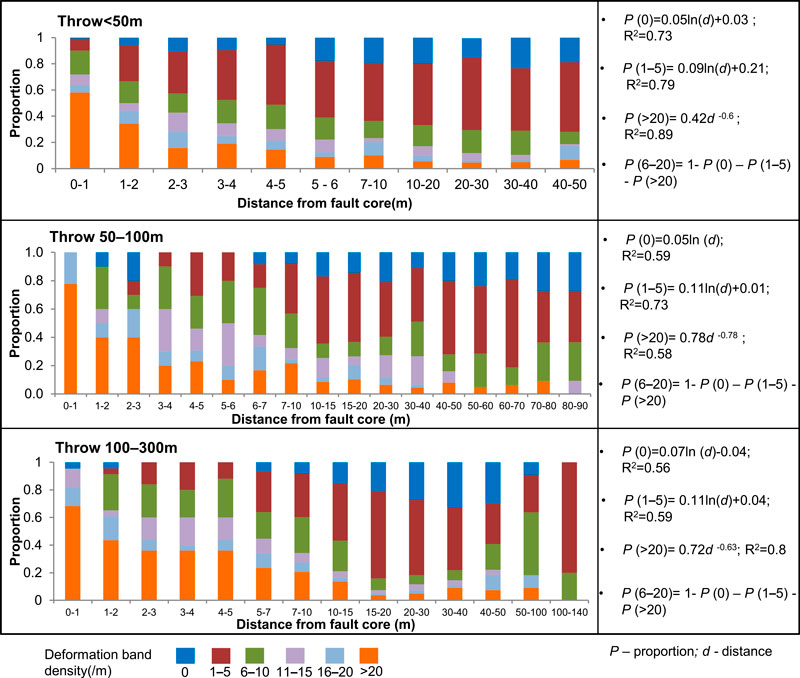
Figure 4. Relationship between facies proportions and distance from the fault core related to three fault throw categories. The functions are listed on the right. P (>20), i.e., the proportion of facies with deformation band density >20/m (orange bar), decreases away from the fault core and shows a power law relationship with the distance to the fault core (d). P (1–5) and P (0), i.e., the proportions of facies with deformation band density 1–5/m (red bar) and 0/m (blue bar), are increasing away from the fault core and show logarithmic relationships with the distance to the fault core (d). The proportion of facies with deformation band density 6–20/m is more or less constant throughout the damage zone.
Figure 4. Relationship between facies proportions and distance from the fault core related to three fault throw categories. The functions are listed on the right. P (>20), i.e., the proportion of facies with deformation band density >20/m (orange bar), decreases away from the fault core and shows a power law relationship with the distance to the fault core (d). P (1–5) and P (0), i.e., the proportions of facies with deformation band density 1–5/m (red bar) and 0/m (blue bar), are increasing away from the fault core and show logarithmic relationships with the distance to the fault core (d). The proportion of facies with deformation band density 6–20/m is more or less constant throughout the damage zone.