The AAPG/Datapages Combined Publications Database
AAPG Bulletin
Figure
AAPG Bulletin; Year: 2018; Issue: June DOI: 10.1306/08291717097
Return to Full Text
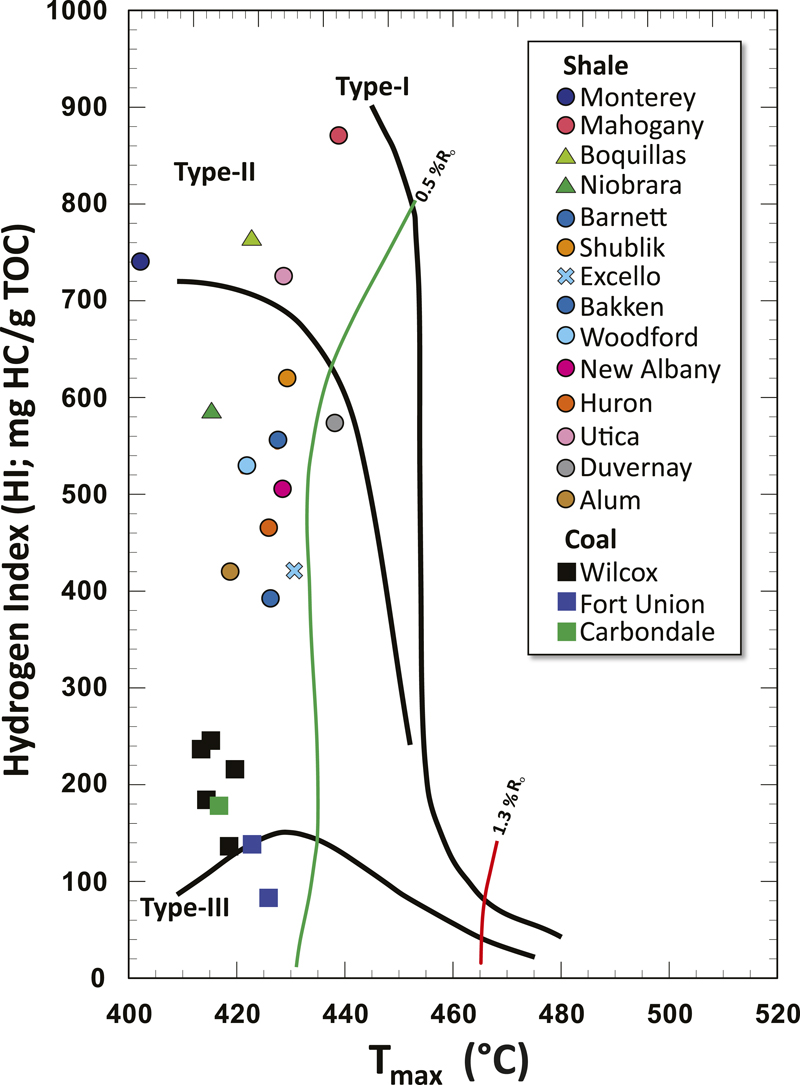
Figure 3. Hydrogen index versus temperature of maximum S2 output (Tmax) plot (Espitalie et al., 1985) showing kerogen types and thermal maturity of sample starting materials. HC = hydrocarbon; Ro = vitrinite reflectance; TOC = total organic carbon.
Figure 3. Hydrogen index versus temperature of maximum S2 output (Tmax) plot (Espitalie et al., 1985) showing kerogen types and thermal maturity of sample starting materials. HC = hydrocarbon; Ro = vitrinite reflectance; TOC = total organic carbon.