The AAPG/Datapages Combined Publications Database
AAPG Bulletin
Figure
AAPG Bulletin; Year: 2019; Issue: January DOI: 10.1306/05111817249
Return to Full Text
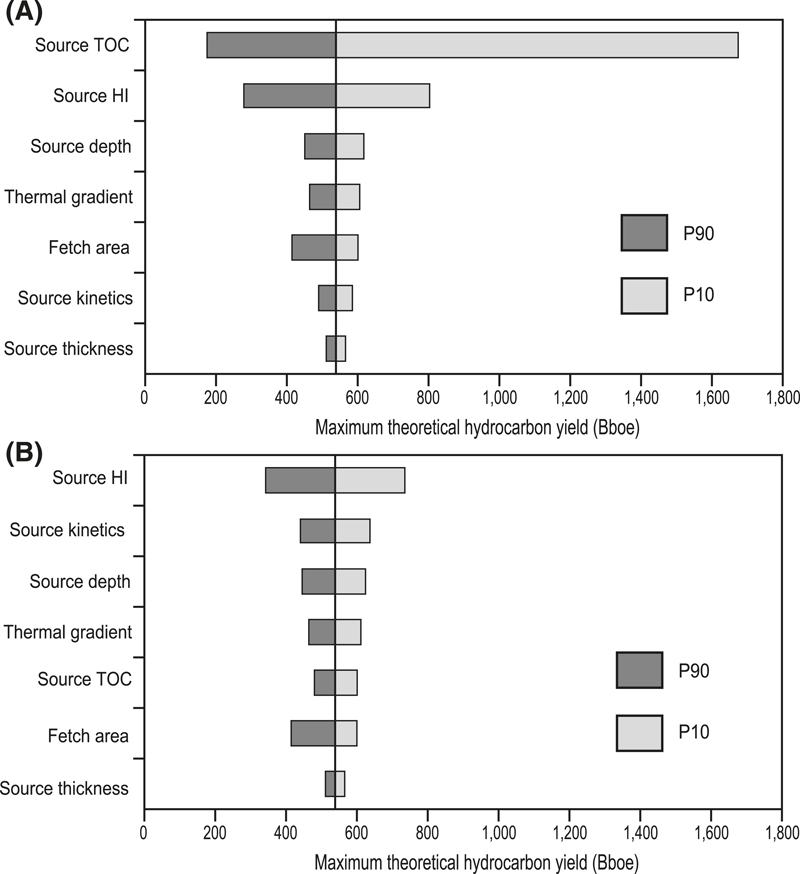
Figure 10. Tornado diagrams comparing the relative impact of each input parameter for (A) Patchawarra Formation shales–coaly shales and (B) Patchawarra Formation coals. Bboe = billion BOE; HI = hydrogen index; P10 = 10% exceedance probability; P50 = 50% exceedance probability; P90 = 90% exceedance probability; TOC = total organic carbon.
Figure 10. Tornado diagrams comparing the relative impact of each input parameter for (A) Patchawarra Formation shales–coaly shales and (B) Patchawarra Formation coals. Bboe = billion BOE; HI = hydrogen index; P10 = 10% exceedance probability; P50 = 50% exceedance probability; P90 = 90% exceedance probability; TOC = total organic carbon.