The AAPG/Datapages Combined Publications Database
AAPG Bulletin
Figure
AAPG Bulletin; Year: 2019; Issue: January DOI: 10.1306/05111817249
Return to Full Text
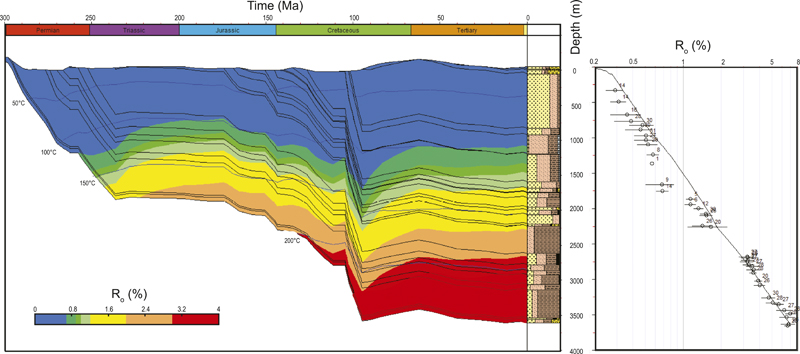
Figure 3. Example of petroleum systems modeling results for Burley 2. See Figure 1 for well location. Left: burial history (solid blue lines indicate isotemperature). Right: modeled maturity-depth profile against observed maturity data. Measured vitrinite reflectance (Ro (%)): open dots. Calculated Ro (%) from a laboratory measurement obtained from Rock-Eval pyrolysis, indicating the stage of maturation of organic matter (Tmax): black dots.
Figure 3. Example of petroleum systems modeling results for Burley 2. See Figure 1 for well location. Left: burial history (solid blue lines indicate isotemperature). Right: modeled maturity-depth profile against observed maturity data. Measured vitrinite reflectance (Ro (%)): open dots. Calculated Ro (%) from a laboratory measurement obtained from Rock-Eval pyrolysis, indicating the stage of maturation of organic matter (Tmax): black dots.