The AAPG/Datapages Combined Publications Database
AAPG Bulletin
Figure
AAPG Bulletin; Year: 2019; Issue: January DOI: 10.1306/05111817249
Return to Full Text
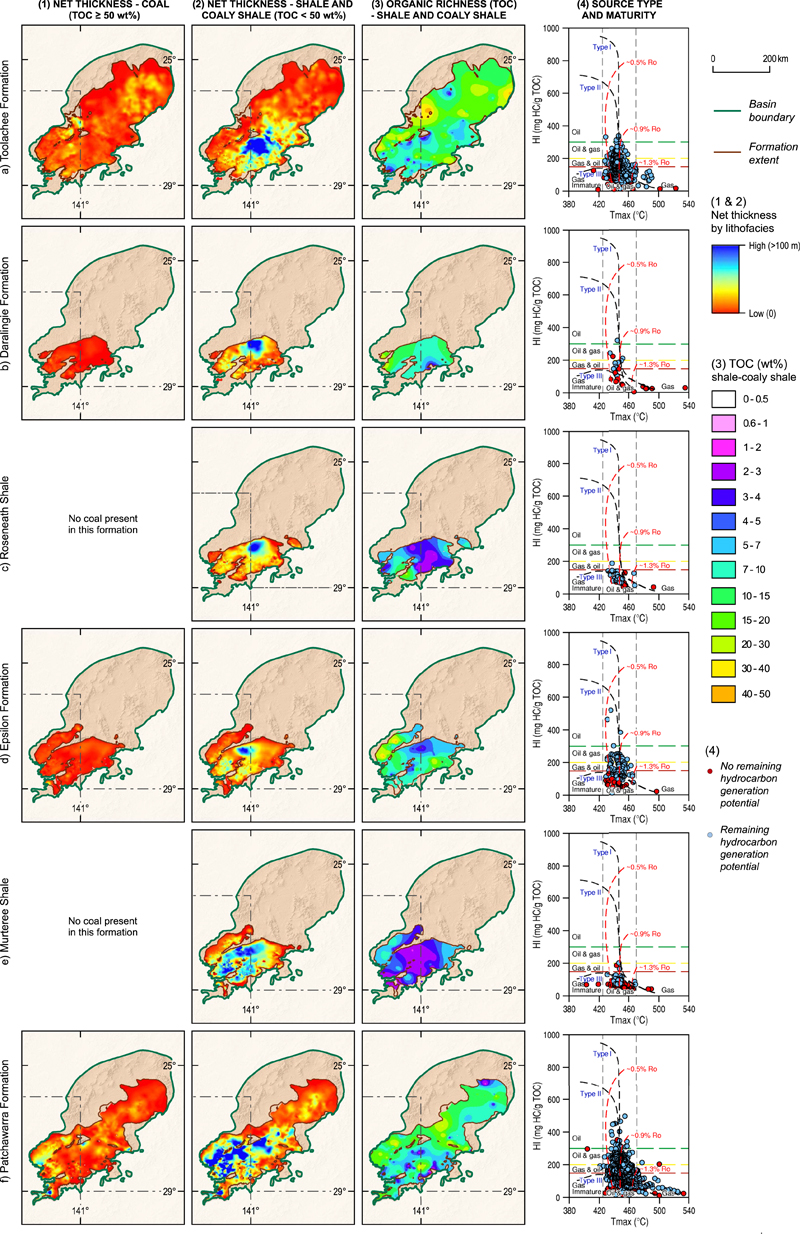
Figure 4. Cooper Basin petroleum source-rock mapping results for the following formations: (A) Toolachee Formation, (B) Daralingie Formation, (C) Roseneath Shale, (D) Epsilon Formation, (E) Murteree Shale, and (F) Patchawarra Formation. Column 1: net coal thickness. Column 2: net shale‒coaly shale thickness. Column 3: total organic carbon (TOC) for shale‒coaly shale source units. Column 4: hydrogen index (HI) versus maturity (Tmax) plots showing the variation in source-rock quality and kerogen type by formation. HC = hydrocarbons; Ro = vitrinite reflectance.
Figure 4. Cooper Basin petroleum source-rock mapping results for the following formations: (A) Toolachee Formation, (B) Daralingie Formation, (C) Roseneath Shale, (D) Epsilon Formation, (E) Murteree Shale, and (F) Patchawarra Formation. Column 1: net coal thickness. Column 2: net shale‒coaly shale thickness. Column 3: total organic carbon (TOC) for shale‒coaly shale source units. Column 4: hydrogen index (HI) versus maturity (Tmax) plots showing the variation in source-rock quality and kerogen type by formation. HC = hydrocarbons; Ro = vitrinite reflectance.