The AAPG/Datapages Combined Publications Database
AAPG Bulletin
Figure
AAPG Bulletin; Year: 2021; Issue: August DOI: 10.1306/02262118214
Return to Full Text
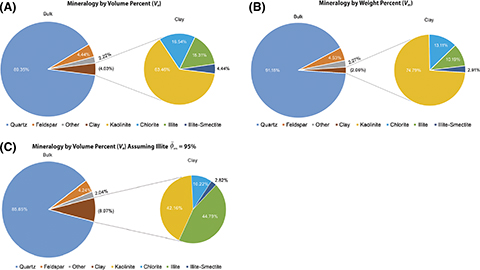
Figure 13.
Pie charts showing the difference in bulk and clay mineralogy from volume percent (A), weight percent (B), and volume percent assuming 95% illite microporosity (C) in reservoir-quality Cypress Sandstone. Mineralogy by weight percent (mean volume of microporosity
Figure 13.
Pie charts showing the difference in bulk and clay mineralogy from volume percent (A), weight percent (B), and volume percent assuming 95% illite microporosity (C) in reservoir-quality Cypress Sandstone. Mineralogy by weight percent (mean volume of microporosity