The AAPG/Datapages Combined Publications Database
AAPG Bulletin
Full Text
![]() Click to view page images in PDF format.
Click to view page images in PDF format.
AAPG Bulletin, V.
Using clay microporosity to improve formation evaluation in potential residual oil zones: Cypress Sandstone, Illinois Basin
Leo G. Giannetta,1 Nathan D. Webb,2 Shane K. Butler,3 and Nathan P. Grigsby4
1Illinois State Geological Survey, Prairie Research Institute, University of Illinois at Urbana-Champaign, Champaign, Illinois; [email protected]
2Illinois State Geological Survey, Prairie Research Institute, University of Illinois at Urbana-Champaign, Champaign, Illinois; [email protected]
3Energy & Environmental Research Center (EERC), Grand Forks, North Dakota; [email protected]
4Illinois State Geological Survey, Prairie Research Institute, University of Illinois at Urbana-Champaign, Champaign, Illinois; [email protected]
ABSTRACT
Clay microporosity in sandstones can cause erroneously high water saturation calculations if not properly accounted for and reduces effective pore space when evaluating a formation. We conducted a petrographic study to characterize and quantify the clay mineral microporosity of the fluvial facies of the Mississippian Cypress Sandstone in the Illinois Basin. These data helped achieve more accurate saturation calculations through core and well-log analyses in potential Cypress residual oil zones.
Petrographic thin sections were analyzed by scanning electron microscopy with backscatter imaging and energy-dispersive x-ray spectroscopy. Clay mineral species identified included pore-filling kaolinite books, blocks, and vermicules; chlorite clusters; illite mats; illite-smectite webs; grain-coating inherited chlorite rims; and pore-bridging illite hairs. Volume percent of microporosity particular to clay mineral species were determined by image analysis. Average microporosity values in kaolinite, chlorite, illite, and illite-smectite were 41%, 57%, 67%, and 65%, respectively. Effective clay mineral volumes, including microporosity, showed a greater than twofold increase over estimates determined by x-ray diffraction, constituting an average volume of 4%. Comparing these volumes with gamma-ray log estimates proved Stieber’s work to predict clay volume most accurately. Clay volumes were used as input parameters in the dual-water method for determining water saturation, resulting in greater residual oil saturations than those predicted from the Archie equation. Accounting for clay microporosity in helium porosimetry measurements of total porosity resulted in an approximate 11% decrease to effective porosity. Results from this research improve estimates of water saturation and porosity and highlight the importance of studying microscale mineralogical properties during reservoir characterization.
INTRODUCTION
Clay minerals, defined in this study as hydrous aluminum (Al) phyllosilicate minerals, are a common constituent in sandstones and can be problematic when evaluating formations. Clay mineral micropores pose a specific problem (Pittman and Thomas, 1979; Hurst and Nadeau, 1995; Desbois et al., 2011; Liu et al., 2011) because they can affect wire-line log responses and reduce effective pore space. The use of scanning electron microscopy (SEM) allows geoscientists to characterize and classify clay minerals in sandstone reservoirs to account for their effect on reservoir properties.
In the Illinois Basin (ILB), the fluvial facies of the Chesterian (Upper Mississippian) Cypress Sandstone is presently being evaluated to identify potential residual oil zones (ROZs) that could be the target of carbon dioxide enhanced oil recovery (CO2–EOR) and geologic CO2 storage. Preliminary geophysical log analysis of Cypress reservoirs using the Archie equation (Archie, 1942) has produced anomalously high water saturation values (>100%), which could be caused by clay microporosity. It is common practice to correct the Archie equation for clay microporosity using clay volumes estimated from gamma ray (GR), including linear relationships (i.e., GR index) or nonlinear relationships (Stieber, Clavier, Larionov). However, GR-derived clay volume estimations are unable to distinguish the origin or species of the clay fraction, which are critical controls on clay microporosity and thus water saturation (Hurst and Nadeau, 1995). The ability to accurately assess water saturation is critical because low oil saturation values are expected in a hypothetical Cypress ROZ. The controls on the clay mineral assemblage within sandstones are complex: studies of sandstones genetically comparable to the Cypress can provide good predictive models, but the clay mineralogy of the Cypress itself will be unique. Thus, a direct investigation of clay minerals specific to the Cypress is necessary to accurately account for the microporosity associated with these minerals.
Microporosity, as distinguished from macroporosity, is defined as the subset of total pore space with pore-aperture radii less than 0.5 µm (Pittman, 1979). In siliciclastic reservoirs such as the Cypress Sandstone, microporosity is commonly associated with detrital and authigenic clay minerals (Pittman, 1979). These clay micropores are invariably water filled and take two forms: capillary-bound water and clay-bound water (Hurst and Nadeau, 1995; Worthington, 2003). Capillary-bound water saturates micropores between clay crystals by capillary condensation when relative vapor pressure in the porous medium allows adsorption of vapor into the liquid phase. Clay-bound water is the electrochemically bound molecular water that is adsorbed at mineral surfaces as the result of negative surface charges, which attract free positive ions in the liquid into the electrical double layer of the mineral. In both cases, the water is considered immobile, remaining stationary during hydrocarbon emplacement, natural water flooding, and production (Pallatt and Thornley, 1990).
The effect of clay microporosity on saturation and porosity measurements can be quantified by determining the origin, volume, and morphology of the clay minerals. Nadeau and Hurst (1991) used SEM to show that the volume of clay mineral microporosity is a function of the crystal morphology (e.g., book, rosette, hairs). This finding was supported by Sardini et al. (2009) through novel approaches in SEM analysis of preserved core and by Desbois et al. (2011) through focused ion beam–SEM analysis. Importantly, studies have shown that air-dried core may not be ideal for quantitative SEM examination. McHardy et al. (1982) and Pallatt et al. (1984) showed that filamentous illite is particularly problematic in permeability reductions and that critical-point dried samples are necessary for understanding the in situ nature of illite in sandstone reservoirs. The present study did not have access to preserved core or focused ion beam–SEM, and applying these methods to multiple cored wells regionally would have been protracted and costly. We adopt the backscattered electron (BSE) imaging technique of Nadeau and Hurst (1991) using air-dried core and assert that it is an effective method for improving formation evaluation in mature, low-clay (especially illite) sandstone reservoirs where preserved core is unavailable.
We use SEM imaging with x-ray diffraction (XRD) to quantify the volume of microporosity within clay minerals in the fluvial facies of the Cypress Sandstone in the ILB. Clay microporosity is separated from total porosity to estimate effective clay mineral volume, effective porosity, and effective water saturation. Results show that both authigenic and detrital clay minerals introduce inaccuracies in formation evaluation of sandstone oil reservoirs. Furthermore, results show that borehole wire-line models that use core-derived clay microporosity values can improve estimates of moveable oil saturation in ROZs. Uncertainties associated with imaging illite from air-dried core are quantified, and readers are advised against applying the methodology of Nadeau and Hurst (1991) using unpreserved core in highly illitic reservoirs.
In this research, we identified a microporosity range of 26%–72% for the total clay mineral volume within four clay mineral groups that exhibited seven morphologies within the Cypress Sandstone. With the clay groups and resultant microporosity present, an average of approximately 11% total porosity could be attributed to clay microporosity, thus providing a typical correction factor for estimates of effective porosity in the Cypress Sandstone. Additionally, we observed a greater than twofold increase in effective clay mineral volume when clay microporosity was considered, which constituted an average of 4% effective clay mineral volume for Cypress reservoir sandstones. Effective clay mineral volumes were compared to shale volume estimates from GR logs, and those determined by the Stieber (1970) equation were found to be the most accurate. Clay volumes were then used as input parameters in methods to develop water saturation curves that would account for immobile water saturation.
GEOLOGIC SETTING AND PETROLEUM RESERVOIRS OF THE CYPRESS SANDSTONE
The ILB is a 110,000-mi2 intracratonic basin located in most of Illinois, southwestern Indiana, western Kentucky, and a small part of Missouri (Figure 1). The ILB was a relatively shallow, gently southward-sloping embayment throughout the Paleozoic. The Chesterian Series in the ILB, part of the Kaskaskia sequence recorded by Sloss (1963), is composed of alternating siliciclastic and carbonate units that record repeated eustatic fluctuations during the Late Mississippian (Smith and Read, 2001).
 Figure 1. Location map of the study area within the Illinois Basin showing the extent of the Cypress Sandstone. The stippled area in southcentral Illinois is the relative location of the fluvial facies of the Cypress. Wells sampled for microporosity analysis are shown with black dots. Figure modified from Nelson et al. (2002). ©2002 University of Illinois Board of Trustees. Used with permission from the Illinois State Geological Survey.
The Cypress Sandstone, located within the Chesterian Series (Figure 2), varies from a thick, relatively clean sandstone in some areas to shale with interbedded sandstone in others. Highly heterogeneous and compartmentalized lenticular reservoirs in the Cypress have been a prolific source of oil production. These reservoirs have been interpreted as tidal sandbars deposited in a nearshore marine environment (Grube, 1992; Whitaker and Finley, 1992; Cole and Nelson, 1995; Xu and Huff, 1995). However, a fairway of 100- to 200-ft-thick fluvial sandstone bodies (Figures 1, 2) also contains oil in relatively thin oil reservoirs that lie above a thick brine aquifer. These bodies consist primarily of well-sorted, fine-grained quartz sandstone with rare interbedded shale and siltstone that commonly grade upward into more heterolithic strata. These thick, fluvial reservoirs, although relatively clean, contain microporous clay minerals. Hereafter, the term Cypress Sandstone will refer to this facies.
 Figure 2. Generalized stratigraphic column of the Illinois Basin in southern Illinois. The column shows a section of the Chesterian Series containing the Cypress Sandstone (Ss) and demonstrates the incision of the Ss into underlying strata. Figure modified from Whitaker and Finley (1992). ©1992 University of Illinois Board of Trustees. Used with permission from the Illinois State Geological Survey. Ls. = Limestone; Sh. = Shale.
METHODS
Sample Selection
A total of 20 samples were chosen from 12 different oil wells with whole core from the Cypress Sandstone (Figure 1). A wide regional distribution was chosen to ensure a representative sample of the fluvial facies of the Cypress Sandstone. Although the sandstone is generally less than 200 ft thick, sample depths range between 1557 and 3185 ft, reflecting the structural configuration of the ILB. Sample locations were chosen to coincide with a full suite of analytical data, including thin sections, bulk and clay mineral analyses from XRD, and helium porosimetry (He-porosity) core plug data. Our quantitative XRD methodology for bulk powder and oriented clay specimens is provided in Appendix 1.
Samples were sent to Wagner Petrographic (Lindon, Utah) for thin-section preparation. Following the procedure of Nadeau and Hurst (1991), the rock was impregnated with low-viscosity blue epoxy by using a low-medium vacuum chamber (
A carbon evaporator was used to coat the polished thin sections with a conductive layer of carbon to prevent sample charging during SEM analysis. Slides were attached to a sample mount by using adhesive carbon pads and liquid silver paint to ensure a conductive ground path.
Image Collection and Analysis
Petrographic thin sections exhibiting clay mineral textures were selected for imaging with a Philips XL30 field emission gun environmental scanning electron microscope equipped with a BSE detector and energy-dispersive x-ray spectroscope. Clay minerals were observed in SEM and BSE images and assessed to identify all clay mineral groups (e.g., kaolinite, chlorite); the locations where they occur (e.g., pore filling, pore lining); and their morphologies (e.g., books, clusters). Together, these attributes define the species (e.g., pore-filling kaolinite books). The TEAM™ software by EDAX (Mahwah, New Jersey) was used for EDS measurements to gain supplementary elemental analyses of the observed clay textures and ultimately to confirm the presence of clay minerals at specific points on the slide. To alleviate the two-dimensional (2-D) bias of SEM and adequately describe the pore geometries in three dimensions (3-D), petrographic thin sections were cut at multiple orientations from core slabs (e.g., perpendicular and parallel to bedding, etc.). The operational conditions of the electron beam during imaging were 20 kV of accelerating voltage, a constant spot size (beam diameter at the surface of the specimen) of 4.0, and a working distance of 10 mm. The scan area for microporosity measurements was 1 mm2 or less, following the guidelines of Dilks and Graham (1985) and Nadeau and Hurst (1991).
The procedure of Nadeau and Hurst (1991) was followed when analyzing images for microporosity, and a procedural explanation is provided in Appendix 2. The contrasts in BSE images reflect variations in atomic number within the specimen. Silicates with high atomic number elements (silica [Si], Al, oxygen [O], etc.) appear light relative to the epoxy resin (carbon [C], hydrogen [H], etc.), which appears dark. The BSE images containing the clay mineral of interest were manipulated with Adobe Photoshop so that darker gray tones (epoxy) were deleted until only the mineral surfaces remained. The percentage of gray tones deleted was equal to the microporosity of the area. The cutoff occurred when the pore space was entirely black and the only gray tones visible were mineral surfaces (Nadeau and Hurst, 1991). This process was performed on areas that contained only the clay mineral texture of interest and in which all pore-aperture radii were
Estimating Clay Volume from Core (Effective Clay Mineral Volume)
Mineralogical weight percentages (Vm) derived from the XRD data give a reasonable estimate of the total solid (or “dry”) clay mineral volume in the formation. However, XRD-derived clay fractions omit the volume of microporosity within clay minerals. For a specific clay mineral in a given sample, microporosity can be used to mathematically correct the solid clay mineral volume to effective clay mineral volume (Ve):
where Vm is the volume of solid clay minerals obtained through XRD analysis of random bulk powder samples, and  is the average clay mineral microporosity (modified from Hurst and Nadeau, 1995). Importantly, this method requires that the densities of all of the clay minerals are the same.
To demonstrate how clay microporosity is accounted for in Ve calculations, we selected an arbitrary sample in which kaolinite was 1.65% of the bulk mineral fraction (0.0165 weight fraction) and microporosity of kaolinite is 41% (0.41 volume fraction). With equation 1, the total effective volume of kaolinite (Vekaol), can be calculated as follows:
Each sample is from a depth with accompanying XRD data, and all samples are from within the fluvial facies of the Cypress Sandstone. For any given sample, the total volume of solid clay minerals equals the sum of Vm values of the clay mineral groups present. The total Ve of any given sample equals the sum of Ve values of the clay mineral groups present. The increase from Vm to Ve quantifies the effect of including clay microporosity in estimates of clay mineral volume. Directly accounting for clay microporosity by using equation 2 is possible only when core and drill cuttings that are representative of formation depths are available for XRD analysis. This is a limitation because core samples are rarer than drill cuttings. Thus, having a means of extrapolating Ve to parts of the Cypress that do not have core or drill cuttings is desirable.
The average method for porosity was used because porosity (and by extension microporosity) is an additive value, which makes an average adequate for our application of screening individual, broadly distributed wells for low oil saturation. More sophisticated upscaling techniques are certainly preferred for variables like permeability and would likely be preferable when building site-specific data sets of microporosity for inclusion into a reservoir model. However, site-specific reservoir modeling is not the focus of this study.
Core Ve versus Clay Volume from Well-Log Analysis (Volume of Shale)
To evaluate a formation, clay volume can be estimated by using GR logs. The GR tools measure the naturally occurring gamma radiation in a rock formation, and because clay minerals contain radioactive isotopes that produce gamma radiation, measurements of gamma radiation can be used to estimate clay mineral volume. These volumetric estimates from GR logs are called volume of shale (Vsh). The term Vsh is derived from the assumption that shale is composed entirely of clay minerals. In reality, shales may be composed of more than 30% quartz and other minerals, which can lead to Vsh estimates that are inaccurate predictions of clay volume (Spooner, 2014).
Calculating a GR index (Igr) is the first step in calculating the Vsh from GR logs. To convert Igr to Vsh, either a linear or near-linear relationship between Igr and Vsh can be used (Spooner, 2014). A linear relationship simply sets Vsh as equal to Igr, but this method commonly overestimates Vsh (Spooner, 2014). Near-linear relationships apply various formulae to modify the linear relationship and were developed to produce more accurate values of Vsh by accounting for the variability in shale properties, such as clay-bound water, particle size, and the distribution of shale throughout the formation.
This study used three near-linear relationships to estimate Vsh: those by Clavier et al. (1971), Stieber (1970), and Larionov (1969). To assess the accuracy of the three near-linear Vsh calculations as predictors of clay volume in the Cypress Sandstone, Vsh values were compared to Ve values at depths that had data for both. This comparison allowed the Vsh method that most accurately predicted the clay volume to be determined as the preferred method for well-log analysis in the Cypress Sandstone.
An important caveat of directly comparing clay volume from core (Ve) to clay volume from well logs (Vsh) is the difference in scale. Vertically, core samples represent approximately 3 in., whereas GR logs have a vertical resolution of approximately 12 in. This mismatch can be remedied by upscaling discrete core data to the scale of well-log data and determining a best fit through regression analysis (Holmes et al., 2013). The present study did not attempt upscaling because the agreement between log- and core-derived clay volume is reasonable (see the Discussion section). This suggests that the GR log can detect the approximate value and general trends and may be a useful tool in wells that do not have core. However, in future core–log calibration studies, we encourage the upscaling technique to resolve differences in scale.
RESULTS
Clay Minerals: Occurrence and Morphology
Four clay mineral groups were identified and interpreted as authigenic in origin: kaolinite, chlorite, illite, and illite-smectite. Additionally, we identified inherited (mechanically infiltrated) chlorite-rich rims. Each authigenic clay mineral group exhibited one or several morphologies specific to each clay group. The identified clay mineral morphologies included kaolinite blocks, books, and vermicules; chlorite rosettes and rims; illite hairs and needles; and illite-smectite webs. These morphologies occurred in pore spaces in four ways: pore filling, grain coating, pore lining, and pore bridging. Table 1 shows the number of samples of the 20 analyzed that contained specific clay mineral groups, occurrences, and morphologies. Relatively large illitic clasts, interpreted to be detrital intraformational shale rip-up clasts, were different from authigenic clay minerals in that the clasts occurred as part of the sandstone matrix and were not considered to exhibit a specific morphology or measurable microporosity.
Authigenic Kaolinite
Authigenic kaolinite, the most abundant clay mineral observed in the Cypress Sandstone, occurred exclusively as pore-filling morphologies, namely, books, blocks, and vermicules. The EDS analysis performed on all three morphologies yielded an elemental spectrum reflective of the chemical formula of kaolinite (Al2Si2O5(OH)4), with nearly equal peaks of Al and Si and no other cations (Figures 3D, 4D).
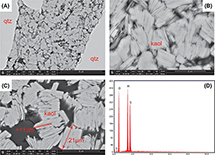 Figure 3. Backscattered electron (BSE) images and energy-dispersive x-ray spectroscopy (EDS) spectrum of authigenic kaolinite (kaol) books. (A, B) Increasing magnification (mag) of the same location. (A) A BSE image of books filling a large void between detrital quartz (qtz) grains. The mag is 1600×. (B) Higher mag of (A) showing books truncated by adjacent aggregates of books. The mag is 6000×. (C) A BSE image of kaol books annotated to show crystal size. The mag is 2400×. (D) The EDS spectrum typical of authigenic kaol taken from an area in image (B). det = detector; HV = high voltage; vCD = low voltage–high contrast detector; WD = working distance.
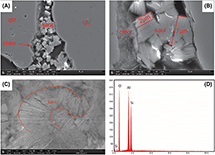 Figure 4. Scanning electron microscopy images and energy-dispersive x-ray spectroscopy (EDS) spectrum of pore-filling kaolinite (kaol) blocks and vermicules. Chlorite (chlor) is labeled where it occurs. (A) The kaol blocks partially filling a pore. Magnification (mag) 2000×. (B) Higher mag of image (A) annotated to show crystal dimensions. The mag is 8000×. (C) The kaol vermicules. Red lines are annotations showing the curving growth habit. The mag is 16,000×. (D) The EDS spectrum taken from the area containing kaol in image (C). det = detector; ETD = Everhart-Thornley detector; GNR = graphene nanoribbon; HV = high voltage; qtz = quartz; SE = secondary electron; WD = working distance.
Kaolinite books were found in 65% of the samples (65% of the thin sections analyzed contained kaolinite books) and occurred as face-to-face stacks of pseudohexagonal books (Figure 3). Crystals of kaolinite books were generally long and thin, measuring >20 µm wide and Figure 3C). Books were randomly oriented in pore spaces and were commonly truncated by adjacent aggregates. Additionally, kaolinite books were not texturally related to minerals that would suggest a replacement reaction (i.e., potassium feldspar [K-feldspar]); rather, they tended to occur in pore spaces between large quartz grains (Figure 3A). Micropores within these pore-filling kaolinite books can be considered secondary porosity (Boles, 1984).
Kaolinite blocks, also referred to in the literature as “blocky kaolinite,” were relatively rare in the Cypress, occurring in 10% of samples. Blocks occurred as face-to-face stacks of blocky, coarse-grained kaolinite crystals oriented randomly in pore spaces (Figure 4A). Like kaolinite books (Figure 3), kaolinite blocks were composed of stacked books but could be distinguished by the crystal dimensions, generally Figure 4B). This low width-to-thickness ratio produced the relatively blocky morphology. These crystal dimensions are in agreement with those of blocky kaolinite observed by Ehrenberg (1993).
Pore-filling kaolinite vermicules were found in approximately 10% of the samples and could easily be distinguished from other kaolinite morphologies by their curving growth habit (Figure 4C). Individual layers of kaolinite vermicules were stacked, thinly laminated layers arranged subparallel to one another.
Authigenic and Inherited Chlorite
Chlorite in the Cypress Sandstone occurred as either mechanically infiltrated clay rims coating detrital framework grains, such as quartz and feldspar (Figure 5A, B), or face-to-edge pore-filling clusters (Figure 6A–C). Mechanically infiltrated chlorite rims were distinguished from the more commonly documented authigenic rosettes based on their face-to-face grain-coating tangential morphology (Wilson, 1992; Worden and Burley, 2003). Grain-coating clay occurrences were difficult to distinguish from similar morphologies, such as authigenic illite or detrital clay mineral fragments, because of the 2-D nature of the petrographic thin sections. Therefore, the presence of chlorite was confirmed by XRD analysis and EDS spectra. The EDS analysis identified both chlorite occurrences as iron [Fe] rich, yielding major elemental peaks of Si, Al, Fe, and minor amounts of magnesium [Mg], reflective of the chemical composition of chlorite ((Mg, Al, Fe)12[(Si, Al)8O20](OH)16; Figures 5D, 6D). Previous research that also identified Fe-rich chlorite in the Cypress Sandstone (Pitman et al., 1998; Seyler et al., 2000) supports this composition. Calculations from quantitative elemental weight percentages obtained by EDS showed authigenic chlorite in the Cypress Sandstone as having Fe/(Fe + Mg) values between 0.7 and 0.8. These values agree with those reported by Hillier (1994), who analyzed a large suite of Fe-rich, grain-coating chlorite from sandstone formations throughout the world.
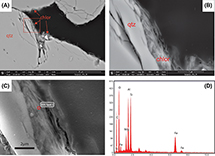 Figure 5. Backscattered electron (BSE) and scanning electron microscopy (SEM) images and energy-dispersive x-ray spectroscopy (EDS) spectrum of inherited chlorite (chlor) rosettes and rims coating detrital quartz (qtz) grains. (A–C) Increasing magnification (mag) of the same location. (A) A BSE image showing rims coating detrital qtz grains. The mag is 2600×. (B) A higher mag of image (A) showing the stacked-rim morphology. The mag is 10,000×. (C) The SEM image of (B). The mag is 20,000×. (D) The EDS spectrum of the inherited rim yielding Fe-rich chlor. Major elemental peaks of Si, Al, and Fe as well as minor amounts of Mg reflect the chemical composition of chlor ((Mg, Al, Fe)12[(Si, Al)8O20](OH)16). The high C peak is the result of C coating during sample preparation. det = detector; HV = high voltage; vCD = low voltage–high contrast detector; WD = working distance.
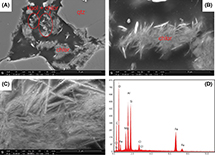 Figure 6. Scanning electron microscopy (SEM) images and energy-dispersive x-ray spectroscopy (EDS) spectrum of pore-filling authigenic chlorite. (A–C) The SEM images showing increasing magnification (mag) of the same location. (A) Chlorite (chlor) clusters occurring throughout pore space and together with kaolinite (kaol). The mag is 2000×. (B) Isolated chlor cluster occurring in pore space. The mag is 8000×. (C) Individual chlor flakes within the cluster from image (B). The mag is 30,000×. (D) The EDS spectrum of Fe-rich chlor taken from the entire area of image (C). Major elemental peaks of Si, Al, and Fe as well as minor amounts of Mg reflect the chemical composition of chlor ((Mg, Al, Fe)12[(Si, Al)8O20](OH)16). The high C peak is the result of C coating during sample preparation. det = detector; ETD = Everhart-Thornley detector; GNR = graphene nanoribbon; HV = high voltage; qtz = quartz; SE = secondary electron; WD = working distance.
Inherited chlorite rims (Figure 5A) occurred in 40% of the samples and are characterized by thin, euhedral, tangential blades stacked randomly, but commonly subparallel, to detrital grain surfaces (Figure 5B, C). The rims were thicker within fractures and reentrants on grain surfaces. Inherited clay rims are less obvious upon cursory petrographic examination than chlorite rosettes and are commonly overlooked without SEM analysis (Bloch et al., 2002). These rims are defined as clay coats that form on and attach to framework grains prior to their deposition and are therefore considered detrital (Wilson, 1992). Mineralogy of infiltrated clays vary because they reflect the mixture of water and materials available at the source area (Walker et al., 1978). In the case of the Cypress, they are mostly chlorite in composition based on EDS (Figure 5D). Other studies documented clay rims to contain large amounts of microporosity (Wilson, 1992). Like authigenic clay species, irreducible bound water within clay rims can contribute to low resistivity, causing inaccurate moveable water saturation estimates in hydrocarbon-bearing intervals (Dolly and Mullarkey, 1996; Byrnes et al., 1998).
Pore-filling authigenic chlorite occurred as clusters of subparallel, face-to-edge crystals (Figure 6B) randomly oriented in pore space (Figure 6A). Clusters of chlorite were rarer than rims and were found in Figure 6A).
Authigenic pore-filling clusters shown in Figure 6 were observed in fewer samples than inherited chlorite rims. This morphology closely resembled illite-smectite fibers, so confirmation of chlorite required supplementary elemental data from EDS and XRD analyses. Face-to-edge clusters of chlorite flakes exhibit a textural relationship with kaolinite (Figure 6A), which suggests recrystallization of a clay precursor derived from kaolinite into authigenic chlorite (Boles and Franks, 1979). Such reactions are known to occur in mesogenetic environments where Fe is supplied by dissolution of illite, detrital clays, or ferromagnesian grains (Carrigy and Mellon, 1964; Burton et al., 1987; Moraes and de Ros, 1990; De Ros et al., 1994; Anjos et al., 2003; Berger et al., 2009). An alternative interpretation is that the chlorite clusters are a function of vacuum-assisted epoxy impregnation during thin-section preparation: grain-coating chlorite may have contracted, bonded, and compacted to form these tightly bonded clusters. However, this is unlikely because (1) a 3-D photomicrograph of core that has not undergone vacuum impregnations shows this occurrence and morphology of chlorite, and (2) vacuum conditions during epoxy impregnation were low to medium (1–10−1 tor). Such morphological damage has not been reported under these vacuum conditions.
Authigenic Illite
Authigenic illite in the Cypress Sandstone occurred as two morphologies: (1) pore-filling mats of intertwined needles (Figure 7A) and (2) hairy strands that lined and bridged pores (Figure 7B). The EDS analyses of both illite morphologies reflected its general chemical formula ((K, H3O)(Al, Mg, Fe)2(Si, Al)4O10[(OH)2,(H2O)]); spectra yielded major amounts of Si, Al, and K and minor amounts of Mg, Ca, and Fe (not labeled; Figure 7D). A distinguishing feature of illite in the EDS spectrum was the K peak, which was less intense than the Al peak. This result contrasts with K-feldspars, for which the K and Al peak intensities were equal.
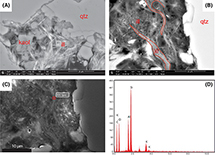 Figure 7. Backscattered electron (BSE) and scanning electron microscopy (SEM) images and energy-dispersive x-ray spectroscopy (EDS) spectrum of authigenic illite (ill). (A) A BSE image of pore-filling mats of intertwined needle ill occurring with blocky kaolinite (kaol). Magnification (mag) 5000×. (B) A BSE image of pore-lining and pore-bridging ribbons of hairy ill. Red lines outline prominent hairs. The mag is 6000×. (C) The SEM image corresponding to (B) taken by the EDAX image collector. (D) The EDS spectrum of typical authigenic ill in the Cypress Sandstone taken from a point (“EDS Spot 1”) on image (C). Major elemental peaks of Al, Si, and K and minor peaks of Mg, Ca, and Fe (not labeled) reflect the chemical formula of ill ((K, H3O)(Al, Mg, Fe)2(Si, Al)4O10[(OH)2,(H2O)]). The high C peak is the result of C coating during sample preparation. det = detector; HV = high voltage; qtz = quartz; vCD = low voltage–high contrast detector; WD = working distance.
Individual needles and hairs of authigenic illite were commonly intergrown with other authigenic clay minerals or lined edges of the detrital framework grains. Specifically, illite could be observed growing on, linking, and replacing kaolinite blocks (Figure 7A). Illite hairs were distinguishable by their curvy, ribbonlike morphology and the tendency to grow into pore space, where single ribbons could act as a sinuous bridge between detrital framework grains (Figure 7B). Illite hairs and mats were present in 35% and 10% of the samples, respectively.
McHardy et al. (1982) showed that originally ribbonlike filamentous illite can flatten against pore walls following air drying. Indeed, Hurst and Nadeau (1995) stated that their estimates of filamentous illite microporosity may have been low because of air drying. However, 3-D photomicrographs of illite hairs from air-dried core from the Cypress show that morphological damage or flattening against pore walls is not significant (Figure 7). Additionally, like Hurst and Nadeau (1995), we acknowledge that our estimates of microporosity in illite hairs may be low.
Authigenic Mixed-Layer Illite-Smectite
Authigenic mixed-layer illite-smectite in the Cypress Sandstone occurred as pore-filling webs. The composition and morphology of the mixed-layer clay was highly variable because it was composed of more than one clay type. The presence of mixed-layer illite-smectite was based on XRD analysis and was substantiated by the EDS analysis and its weblike morphology (Figure 8A, B).
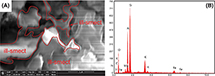 Figure 8. (A) Scanning electron microscopy image of pore-filling webs of mixed-layer illite-smectite (ill-smect). The entire image is considered ill-smect. Red annotations show individual webs. Magnification (mag) 30,000×. (B) Energy-dispersive x-ray spectroscopy (EDS) spectrum from the entire area of image (A) showing major elements of K, Al, Mg, and Fe, partially reflecting the chemical composition of illite ((K, H3O)(Al, Mg, Fe)2(Si, Al)4O10[(OH)2,(H2O)]). The elemental composition from EDS analysis did not confirm ill-smect. The presence of ill-smect was confirmed by x-ray diffraction analysis and was substantiated by the morphology and EDS spectrum. The bright line distortions at the bottom right of image (A) resulted from sample charging. det = detector; HV = high voltage; vCD = low voltage–high contrast detector; WD = working distance.
A problematic factor in identifying illite-smectite in the EDS spectrum was that individual webs were relatively thin compared to other morphologies, which allowed the electron beam to penetrate through the clay into an underlying material with a differing composition. This penetration could have caused the Fe peak (Figure 8B), which was not generally representative of illite-smectite. The difficulty in identifying illite-smectite through the SEM and EDS analyses resulted in a relatively low number of confident observations compared to those for other mineral types. Consequently, the types not confidently observed were not included in this study.
Wilson et al. (2014) showed that mixed-layer illite-smectite may simply be very thin illite in the early stages of growth. It is shown that correctly distinguishing mixed-layer illite-smectite as thin illite is important for wellbore instability issues in aqueous environments (Wilson et al., 2014). However, because illite-smectite content in the Cypress is quite low (
Detrital Illitic Clasts
Detrital clay minerals in the Cypress Sandstone occurred within sand-sized clasts (Figure 9A). Although more common in heterolithic facies than in clean sandstone, the clasts were observed in several samples from the clean sandstone as well. On the basis of petrographic and SEM studies, detrital clasts were significantly less common than authigenic clay minerals. Clasts appeared to act as framework grains, similar to individual quartz grains. The size of individual clasts was variable, but they were generally much larger than those of authigenic clay minerals (Figure 9A). Several structures were visible within the clasts. Some showed thin, well-developed laminations that could be signs of compaction during original deposition of the clasts (Figure 9A), and others showed a fibrous texture that could be indicative of pure illite (Figure 9B). The clasts were illitic in composition, yielding Si, Al, and K as major elements (Figure 9D), and are referred to hereafter as illitic clasts.
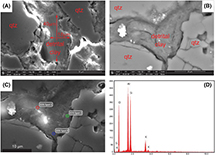 Figure 9. Images of detrital sand-sized illitic clasts in the Cypress Sandstone. (A) Scanning electron microscopy (SEM) image of a large laminated clast. Magnification (mag) 2400×. (B) Backscattered electron image of a smaller clast between framework grains showing a fibrous texture. The mag is 6000×. (C) The SEM image collected by the EDAX image collector corresponding to (B). The clast could be interpreted as a laminated detrital clay on the basis of the areas shown in images in (B, C); however, the clast is discontinuous outside the area shown. (D) Energy-dispersive x-ray spectroscopy (EDS) spectrum typical of illitic detrital clay clasts in the Cypress Sandstone, which was taken from EDS Spot 2 on (C). The major elements of Si, Al, and K reflect the chemical composition of illite ((K, H3O)(Al, Mg, Fe)2(Si, Al)4O10[(OH)2,(H2O)]). All EDS spots taken from (C) yielded nearly identical elemental spectra. Glowing regions are the result of charging during sample–electron beam interaction. det = detector; ETD = Everhart-Thornley detector; GNR = graphene nanoribbon; HV = high voltage; qtz = quartz; SE = secondary electron; WD = working distance.
The 3-D SEM Images from Unpolished Air-Dried Core Chips
To substantiate the existence and preservation of clay mineral morphologies identified within 2-D thin sections, we provide 3-D SEM images of the morphologies within air-dried core from the Cypress Sandstone (Figure 10). Importantly, delicate clay morphologies such as illite hairs (Figure 10H, I) appear intact following air drying.
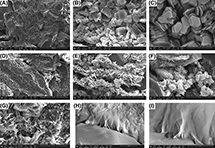 Figure 10. Three-dimensional scanning electron microscopy (SEM) images of microporous clay minerals observed from air-dried core samples of the Cypress Sandstone. All images are secondary electron (SE) unless otherwise stated. (A) Pore-filling kaolinite. (B) Backscattered electron (BSE) image of pore-filling kaolinite vermicules. (C) Pore-filling kaolinite books. (D) Inherited chlorite-rich rims. (E) Elongated pore-filling chlorite clusters. Note face-to-edge contacts between individual blades. (F) Pore-filling chlorite clusters intergrown with blocky kaolinite. (G) Pore-filling intertwined needles of illite. (H) Pore-bridging ribbons of hairy illite. (I) Increased magnification (mag) of (H) showing individual hairs of illite latching to quartz surfaces. det = detector; ETD = Everhart-Thornley detector; HV = high voltage; LFD = large field detector; WD = working distance.
Clay Microporosity Results
Results from the BSE image analysis (Figure 11) showed significant microporosity in authigenic clay minerals within the Cypress Sandstone. Microporosity in illitic detrital clasts was not determined because compared to authigenic clay minerals, detrital clay minerals have uniformly lower microporosity (Hurst and Nadeau, 1995).
 Figure 11. Example of computer-assisted backscattered electron image analysis of microporous kaolinite books. (A) Image with complete gray tone scale. (B) Image after deletion of gray tones (microporosity). Dotted yellow lines show the mineral–epoxy boundary before and after the fuzzy halo of gray tones is deleted. The blue circle and arrows in (B) show the pore-aperture diameter of the largest pore (1 μm). The red arrow shows the pore-aperture radii of the largest pore (0.5 μm;
Clay microporosity values were specific to both the clay mineral group and the morphology. The values presented here are the average microporosity values for each clay type. In addition, the average microporosity for each clay mineral was weighted by the relative abundance of its morphological occurrences. It should be noted that the mobility of water in clay micropores can differ by the type of micropore that holds the water such that clay-bound water could be less mobile than capillary-bound water. In this study, we did not differentiate between the two types of clay microporosity; thus, analyses did not account for the potential for different water mobility values within the micropores. Rather, we defined clay microporosity as including both clay-bound water and capillary-bound water, provided that the aperture radii of pores within the clay minerals were
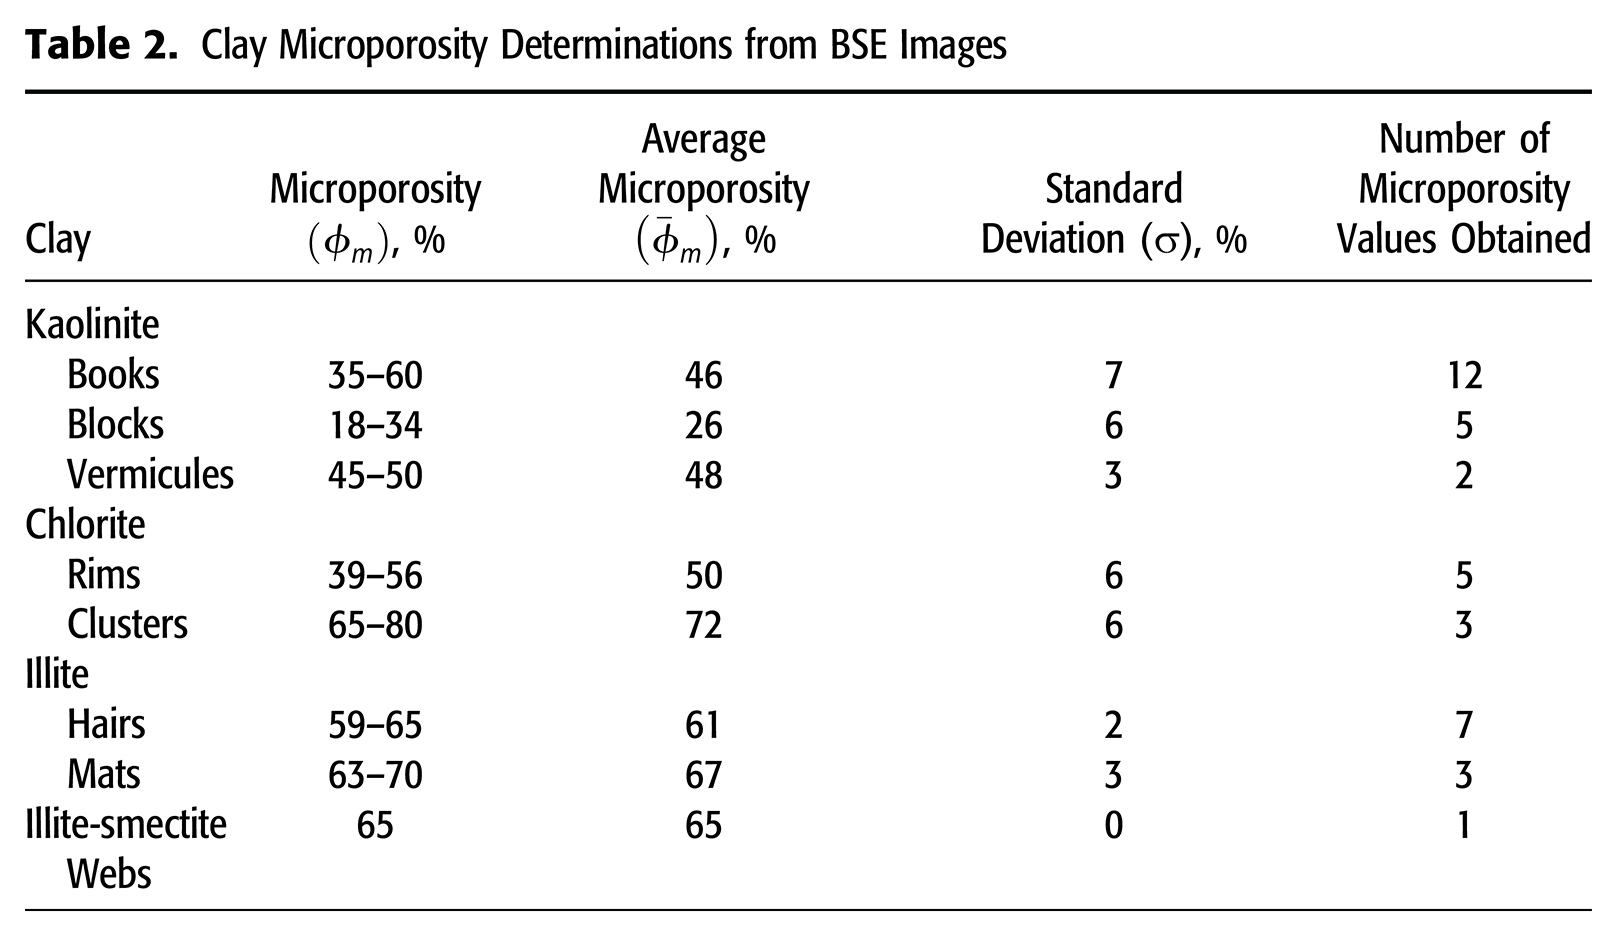
The results of the microporosity analysis are summarized in Table 2. Kaolinite was found to have an average microporosity of 41%, with three different microporosity values corresponding to its three morphological occurrences. Kaolinite books, blocks, and vermicules contained 46%, 26%, and 48% microporosity, respectively. Inherited chlorite rims contained 50% microporosity, and chlorite clusters contained 72%, producing an average of 58% microporosity in chlorite. Illite had an average of 63% microporosity, and illite hairs (61%) contained less microporosity than illite mats (67%). Last, mixed-layer illite-smectite had an average of 65% microporosity.
It is important to note that in situ morphologies of delicate illite are subject to shrinkage effects during standard air drying of core samples (McHardy et al., 1982; Kantorowicz, 1990). To observe true in situ morphologies of delicate illite morphologies, such as hairs, from the Cypress Sandstone, cores must be preserved and formation water must be replaced by a graded sequence of aqueous methanol solutions and critically point dried from liquid CO2 (McHardy et al., 1982). This procedure is protracted; thus, it is rarely used in industry or academia (Wilson et al., 2014). Observations of delicate illite hairs in the Cypress Sandstone did appear well preserved, however, and were generally reflective of the authigenic illite morphologies observed in SEM photomicrographs from other studies (Welton, 1984). Nonetheless, because illite hairs can contract during air drying, the microporosity values of illite obtained by BSE image analysis may be low (Nadeau and Hurst, 1991; Hurst and Nadeau, 1995). Hurst and Nadeau (1995) observed fibrous illite using critical-point dried samples and showed that the mineral could have microporosity in excess of 90%. Similar morphological damage has not been documented for illite-smectite webs, but delicate morphology of the mixed-layer clay suggests it could also be susceptible to damage during air drying. To address the potential effect of underestimating microporosity caused by morphological damage during air drying, we present a sensitivity analysis of effective clay mineral volume, effective water saturation, and effective porosity in the case of illite microporosity being 95% (see the Discussion section).
Although clay mineral microporosity values have been determined and published for other reservoir sandstones, the fact that morphology controls microporosity necessitates investigating the clay mineral morphologies specific to each sandstone. Because well-log analyses are sensitive to minor changes in microporosity, simply applying “typical” microporosity values to clay minerals could produce inaccurate fluid saturation estimations, which could result in potential ROZs being overlooked.
Clay microporosity is a function of clay morphology, and the average microporosity  for a given clay mineral is a function of the morphologies identified for that clay mineral. Several clay mineral morphologies in the Cypress Sandstone were not pervasive; rather, they occurred locally in certain regions of the ILB. Performing an SEM analysis on a sample set with a wide spatial distribution in the ILB (Figure 1) led to the identification of morphologies that would otherwise have been missed. For example, kaolinite blocks were observed only in samples from the southern, structurally deeper Cypress Sandstone cores and may reflect a distinct diagenetic history.
Some morphologies are considered typical for clay minerals in sandstone, including kaolinite books and illite hairs. Conversely, some clay mineral morphologies are considered atypical, such as kaolinite blocks, chlorite clusters, and illite mats (Wilson et al., 2014).
Figure 12 shows the microporosity distribution of the clay mineral groups and their morphologies identified in the Cypress Sandstone. Average microporosity values for the clay mineral groups depend on the microporosity of the individual morphologies exhibited by the groups. Therefore, the average microporosity values obtained for kaolinite, chlorite, and illite reflect a combination of typical and atypical morphologies. Kaolinite exhibited three morphologies, namely, books, blocks, and vermicules, which, when averaged, resulted in a microporosity value of 41%. This average would be significantly higher if blocky kaolinite, the morphology with the lowest microporosity (26%), had not been identified and included.
 Figure 12. Box and whisker plot of the distribution of clay microporosity values for each clay mineral group and morphology in the Cypress Sandstone. The whiskers extending outside the box represent minimum and maximum values, the top and bottom of the box are the first and third quartiles, the line inside the box is the median, and the X inside the box is the average. Illite-smectite is not plotted because it exhibits only one morphology.
Chlorite demonstrated the same concept. Inherited chlorite rims contained 50% microporosity in the Cypress. The microporosity of chlorite increased to 57% when the occurrence of highly microporous chlorite clusters (72%) was included. Unlike kaolinite and chlorite, illite hairs and mats exhibited microporosity values that were numerically closer; specifically, the hairs and mats had a relatively low range of microporosity compared to the other clay groups and had an average microporosity of 63%. The only morphology identified for illite-smectite (webs) had a microporosity of 65%.
The average clay microporosity values found in this study were within 6% of the values reported in previous studies. Hurst and Nadeau (1995), following the same procedure of computer-assisted BSE image analysis as Nadeau and Hurst (1991), found kaolinite, chlorite, and illite to have average microporosity values of 43%, 51%, and 63%, respectively. Sardini et al. (2009) found kaolinite and illite to have microporosity values of 42% and 70%, respectively, as determined by porosity in clay mineral aggregates (defined as microporosity in this study). Sardini et al. (2009) used BSE image analysis of dried rock that underwent radioactive resin (14C-methyl-metharcylate) impregnation and subsequent in situ polymerization (14C-PMMA). The relatively similar clay microporosity values found in this study and by Hurst and Nadeau (1995) and Sardini et al. (2009) support the reliability of the method used by Nadeau and Hurst (1991).
DISCUSSION
Applications to Clay Volume and Water Saturation
Clay microporosity creates a source of excess formation conductivity and contributes to the low-resistivity pay problem, in which water saturation (Sw) calculations are erroneously high (Hurst and Nadeau, 1995). This high Sw can give the impression that an oil-bearing rock is entirely water saturated (Worthington, 2003). The identification of ROZs is especially sensitive to this problem because oil saturation is already expected to be low. Thus, even slightly overestimating Sw could result in substantially underestimating the vertical extent of the ROZ. In extremes cases, the overestimation could cause an ROZ to be overlooked entirely. Quantitative textural data from BSE imaging allow clay mineral microporosity to be measured directly, the results of which can be used to amend overestimations of Sw. Specifically, a value for the effective clay mineral volume (Ve) can be determined by coupling XRD analysis with clay microporosity values, which provides an estimation of both dry clay minerals and the volume of water-saturated clay micropores. For the purpose of log analysis, the volume of water-saturated clay micropores provides an estimation of the volume of clay-bound water (Hurst and Nadeau, 1995).
In the sections that follow, values of Ve are compared to the volume of shale (Vsh), that is, the clay volume estimated from wire-line logs, to determine the accuracy of Vsh as a predictor of clay volume. Three Vsh methods using GR logs are presented and compared to Ve, and the most accurate Vsh method is determined. It is important to note that clay volume estimates from Ve and Vsh both include clay-bound water, thus permitting a direct comparison between the two.
Estimating Clay Volume from Core Ve
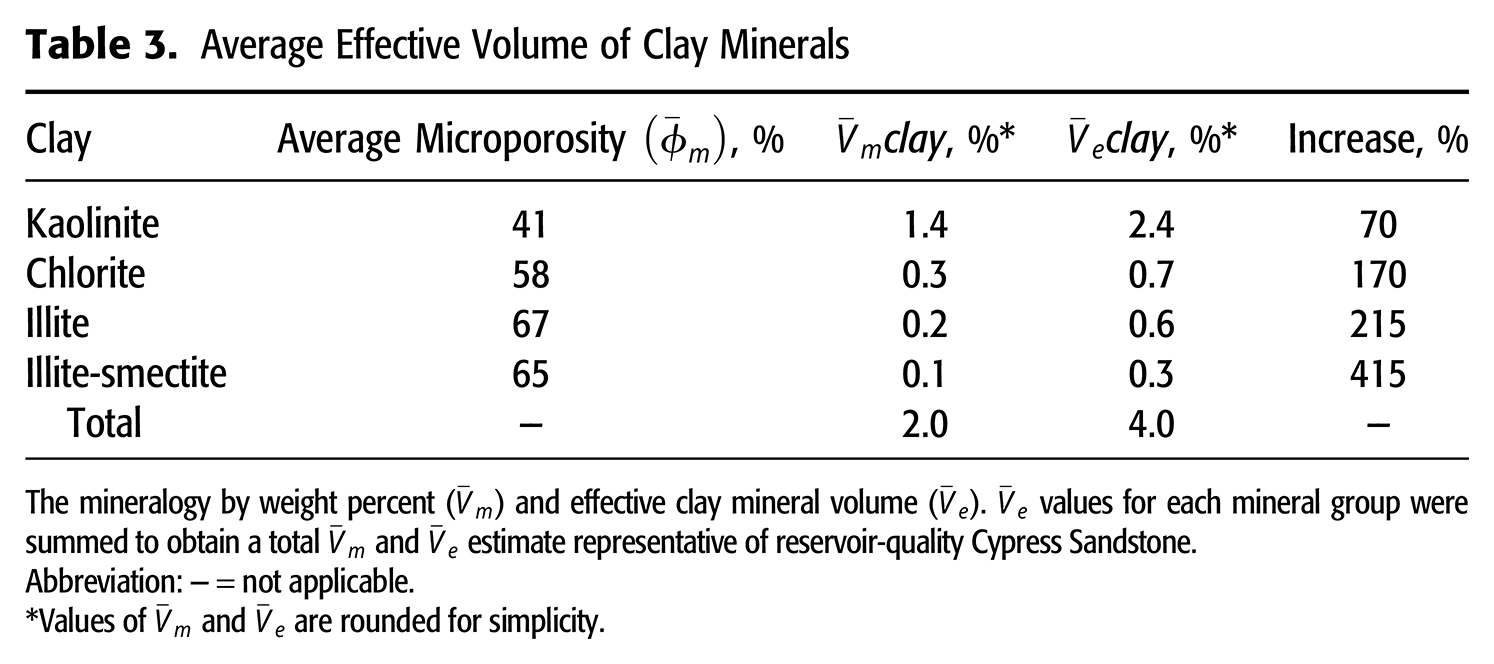
To extrapolate Ve to wells without available core, a single Ve was derived for reservoir-quality Cypress Sandstone, defined here as sandstone samples that contain Ve value was calculated for 56 samples of reservoir-quality Cypress Sandstone from 3 wells, providing a value for Vm and Ve for each sample. The 56 Vm and Ve values were averaged, resulting in values of 2% Vm and 4% Ve (Table 3). Figure 13 shows the resulting change in bulk and clay mineralogy by correcting Vm (Figure 13B) to Ve (Figure 13C) for reservoir-quality Cypress Sandstone.
 Figure 13. Pie charts showing the difference in bulk and clay mineralogy from volume percent (A), weight percent (B), and volume percent assuming 95% illite microporosity (C) in reservoir-quality Cypress Sandstone. Mineralogy by weight percent (mean volume of microporosity [Vm]) is taken directly from the x-ray diffraction (XRD) analysis. Volume percent (effective clay mineral volume [Ve]) is acquired by accounting for clay microporosity in XRD data. Data represent all 56 sample depths from the 3 wells analyzed in this study.
  = average clay mineral microporosity.
In the case of illite microporosity equaling 95%, the Vm to Ve correction for reservoir-quality Cypress Sandstone yields an increase to 8% bulk Ve (Figure 13C). The corresponding change in the illite proportion within the clay fraction is an increase from 10% illite (Vm) to 45% illite (Ve). Although 95% illite microporosity is the high-end estimate (Hurst and Nadeau, 1995), we can reasonably conclude that Ve estimates are strongly susceptible to illite microporosity measurements.
Broadly applying 4% Ve to account for clay microporosity in well-log analyses requires two assumptions about the geology of reservoir-quality Cypress Sandstone. First, clay minerals in reservoir-quality sandstones are assumed to contain their average measured microporosity values as defined in Table 1. The possible variability of the specific morphologies present, or the possible occurrence of morphologies not observed in this study, is not accounted for. Second, Ve is averaged for the entire thickness of reservoir-quality sandstone, which assumes that the facies is homogeneous, containing (1) a constant clay weight percentage of Ve cannot be applied. Assumptions regarding the lithological homogeneity of sandstone in the fluvial facies of the Cypress Sandstone are based on a detailed characterization of an example reservoir by Webb and Grigsby (2020).
It is important to note that Ve could be slightly overestimated if a significant number of detrital illitic clasts are in the sample and their mineralogy is reflected in the XRD results. However, EDS analysis of all detrital clay minerals in this study yielded an illitic composition. The relatively low abundance of illite measured by XRD (
Clay Volume from Core (Ve) versus Clay Volume from Well-Log Analysis (Vsh)
Figure 14 shows the comparison between Ve and the three Vsh methods as a function of depth throughout a section of the Cypress Sandstone. Also shown is Ve in the case of 95% illite microporosity. Using Ve from data-driven microporosity values produces a better fit with Vsh estimates than does Ve in the case of 95% illite microporosity (Figure 14). This section is not considered entirely sandstone of reservoir quality (Ve estimations, the lower part of the sandstone (2598.5–2610 ft) has a lower clay content (Figure 14 shows how well the estimates of Vsh from various GR methods align with the measured Ve. Throughout the section, curves produced by Vsh (Larionov, 1969) and Vsh (Clavier et al., 1984) overpredict the clay volume more significantly than do curves produced by Vsh (Stieber, 1970), which best approximate Ve. Additionally, estimates of Vsh are in better agreement with Ve in the lower part of the sandstone than in the upper part. This result implies that Vsh may be more accurate when the clay volume is low.
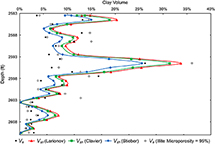 Figure 14. Graph showing relationships of effective clay mineral volume (Ve), assuming illite microporosity = 95%, and the three gamma-ray volume of shale (Vsh) estimates as a function of depth throughout a section of the Cypress Sandstone. Interval from the John O. Coen 120 well (API 121592608300, Section 4, T3N, R9E).
A quantitative comparison of Ve to the three Vsh methods (Figure 15) produced relatively similar correlation coefficients, ranging from 0.514 to 0.521. The Stieber relationship produced one of the highest of the three correlation coefficients: 0.5212. Although the difference in correlation coefficients was marginal (Vsh Stieber method is the most accurate Vsh method for predicting clay volume in the Cypress Sandstone.
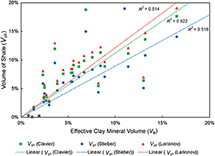 Figure 15. An x,y plot showing the correlation strengths between Ve and the three gamma-ray Vsh methods. The coefficient of determination (R2) denotes the accuracy of each Vsh method as a predictor of clay volume. Data taken from Figure 14. From the John O. Coen 120 well (API 121592608300, Section 4, T3N, R9E).
The Sw and the Dual-Water Method
The fundamental relationship for using well logs to estimate Sw was given by the Archie equation (Archie, 1942). However, the Archie equation assumes that free water within the formation is the only source of conductivity; thus, it does not account for the extra conductivity attributed to clay microporosity and can overestimate Sw in clay-bearing sandstones. As a result, this study used the dual-water method, as developed by Clavier et al. (1984), to account for clay microporosity in Sw estimations in the Cypress.
Clavier et al. (1984) modified the equation of Waxman and Smits (1968) to create the dual-water method, to account for the contribution to the formation water of exchange cations in clay minerals and additional anions in the electrical double layer of clay minerals. The resulting equation for the dual-water method included two types of water: free water and clay-bound water. The dual-water method by Dewan (1983) used in this paper can be expressed as follows:
where Swe is the effective water saturation, Swt is the total water saturation, and Swb is the clay-bound water saturation.
The dual-water method removes the conductivity of clay-bound water from the total formation conductivity, leading to Sw values that are considered effective. To obtain the necessary parameters to use the dual-water method, a volume of clay-bound water per total pore volume (Swb) is required. This value can be determined by relating Vsh to the porosity of shale and total porosity. Dewan (1983) expressed this relationship as
where  is the porosity of the shale formation used to calibrate the well-log analysis, which is used to estimate clay microporosity in this equation; and ϕtotal is the total porosity estimated from the well-log analysis.
As represented in equation 4, estimates of clay volume (Vsh) for calculations of Swb are commonly obtained from log analyses. However, using Ve rather than Vsh provides a more direct measurement of the clay minerals by accounting for only dry clay and clay microporosity. Additionally, the value for  , which is used to estimate clay microporosity in equation 4, is the total porosity of the shale formation and is therefore also reliant on the assumption that the shale is composed entirely of clay minerals. Changing this equation by using Ve and clay microporosity obviates the need to calibrate the method to a shale of uncertain composition. By using clay microporosity and Ve to calculate Swb, equation 4 becomes
where  is the average microporosity of all clay minerals, obtained by normalizing the average microporosity of the four clay groups (kaolinite, chlorite, illite, and illite-smectite) with their average relative proportions (clay fractions from XRD data).
To calculate Sw, clay microporosity is assumed to be a good estimate of clay-bound water (Hurst and Nadeau, 1995). Thus, using Ve for the Cypress Sandstone (4%) as the input parameter for Vsh in calculations of Swb offers a semiquantitative way of accounting for both dry clay and clay-bound water in the dual-water method.
Figure 16 shows a comparison of Sw curves generated by the Archie equation (Archie, 1942) and the dual-water method throughout a depth interval of the Cypress Sandstone. Two dual-water curves are shown: one that uses the clay mineral volume estimated from GR logs according to the Stieber (1970) equation (Vsh) and one that uses the 4% effective clay mineral volume calculated for Cypress reservoir sandstones (Ve). An additional dual-water curve is presented that uses the 8% Ve estimated from 95% illite microporosity. The dual-water curves account for the excess conductivity of clay minerals by removing their effect from estimates of Sw.
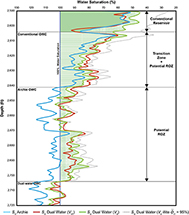 Figure 16. Water saturation Sw curves from a Cypress Sandstone interval. Logged interval from the John O. Coen 120 well (API 121592608300, Section 4, T3N, R9E). Well produced from the Cypress.
  = average clay mineral microporosity; OWC = oil–water contact; ROZ = residual oil zone; Sw Archie = water saturation from the Archie equation (Archie, 1942); Sw Dual Water (Ve) = water saturation with a clay mineral volume input of 4%; Sw Dual Water (Ve illite
  = 95%) = water saturation with a clay mineral volume input of 8%; Sw Dual Water (Vsh) = water saturation with the clay mineral content estimated from gamma-ray logs; Ve = effective clay mineral volume; Vsh = volume of shale.
The three data-driven Sw curves in Figure 16 show relatively low Sw values (40%–60%) at the top of the Cypress between 2590 and 2604 ft (789.4 and 793.7 m). The Sw as predicted by 8% Ve at the top-Cypress interval is substantially different from the other curve and yields Sw values up to 60%. Additionally, all four curves predict a zone of increasing Sw with depth between 2604 and 2641 ft (793.7 and 805 m). The Sw predicted by the Archie equation (Archie, 1942) crosses the 100% Sw line at 2641 ft (Figure 16; Archie oil–water contact [OWC]). The dual-water method, however, predicts Sh as less than 100% from 2604 to 2704 ft (Figure 16; dual-water OWC). A comparison of the Sw in Figure 16 shows that if the depth interval illustrated were a potential ROZ, then applying the dual-water method would result in a greater show of residual oil. An important result is that the dual-water OWC depth predicted by the Sw curve of 8% Ve (95% illite microporosity) agrees with that of the other two dual-water curves. Thus, in Cypress where illite is approximately 1% of the bulk mineralogical fraction, effective Sw estimates within the ROZ are not severely impacted by the uncertainty of illite microporosity. Sandstones with greater illite abundance would be more severely impacted by this uncertainty, and in those situations, using critical-point dried core for illite characterization is strongly advised.
Aside from the conventional reservoir in the upper part of the Cypress, the logged interval in Figure 16 shows minor deviation between the three dual-water curves, with occasional zones of difference. An important difference at the lower part of the ROZ is that the Sw dual water (Ve) based on 95% illite microporosity predicts lower Sw values than the other two dual-water curves. Such a difference could impact volumetric estimates of oil in place. One pitfall of applying Sw dual water (Ve) is that a constant volume of clay (4%) is used throughout the interval, whereas the Sw dual water (Vsh) is variable with depth. Therefore, saturation in zones with a clay volume significantly different from 4% would be better predicted by Sw dual water (Vsh). For example, at 2606 ft (Figure 16), the difference between Sw dual water (Ve) and Sw dual water (Vsh) is significant. As shown in Figure 14, Vsh predicts this depth as having a clay volume of approximately 15%, whereas Ve predicts a constant clay volume of 4%. If Ve is used as a constant clay volume, this zone with a clay volume of approximately 15% will not be accounted for.
Core-derived clay mineral data have recently been used successfully in the dual-water method to improve the accuracy of Sw (see Daigle et al., 2015; Rahim and Watson, 2015; Yadav and Das, 2015). Laboratory measurements of the cation-exchange capacity from core are commonly used to correct for the volume of clay-bound water in the dual-water method. Additionally, direct measurement of the clay mineral volume by XRD has been used in the dual-water method to account for expandable clays and to calibrate Vsh estimates (Ugbo, 2007). The present study corrects the dual-water method to account for the volumetric contribution of specific clay mineral morphologies and their water-filled micropores. This is a geologic approach to a well-log analysis problem. In this case, the accuracy could be determined by a subsequent study of the Cypress, in which Ve dual-water results would be compared to Sw results obtained by using other methods of well-log analysis.
Applications to Effective Porosity
Effective porosity is the interconnected pore volume in rock that contributes to its permeability. Clay mineral microporosity is considered ineffective and will not contribute to fluid flow (Pittman, 1979; Pallatt and Thornley, 1990; Hurst and Nadeau, 1995). Moreover, Pittman (1979) showed though through mercury injection capillary pressure tests that significant flow breakthrough did not occur until approximately 0.5 µm. Our quantitative measurements of clay microporosity satisfy both the geometric and clay mineral criteria and are therefore considered immobile microporosity (see Figure 11) and should be accounted for in effective porosity estimates. Similar to correcting Sw estimates to account for immobile water in clay minerals, measurements of total porosity (ϕt) can be corrected to account for clay microporosity (ϕm) in estimates of effective porosity (ϕe).
The porosity model for the Cypress Sandstone assumes that clay microporosity is the only ineffective porosity in the reservoir. The ϕe is given by the total porosity minus the clay microporosity at a single depth:
Similar to Ve, ϕe is a function of the weight percentage of clay minerals present and the microporosity within those clay minerals. When accounting for clay microporosity in total porosity, the reduction in porosity is directly related to the increase in clay mineral volume (Figure 17).
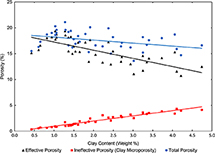 Figure 17. Graph showing the effect of clay content (by weight percent) on total porosity, effective porosity, and ineffective porosity (clay microporosity) for Cypress Sandstone of reservoir quality. Data are from the John O. Coen 120 well (API 121592608300, Section 4, T3N, R9E) and the C. T. Montgomery B-34 well (API 121592606400, Section 3, T3N, 93E). The clay content by weight percent was obtained by x-ray diffraction analysis.
An average of 16.5% effective porosity was estimated in Cypress Sandstone samples in which the clay weight was
The He-porosimeter used 1-in.-diameter core plugs to allow He gas to penetrate the 3-D interconnected pores of the core sample. The He atoms are known to penetrate pore apertures as small as 0.1 nm (Nabawy et al., 2009), whereas microporosities (considered ineffective) are pore systems with aperture radii
Values of ϕe obtained by using equation 6 are reasonable for reservoirs of the thick Cypress Sandstone. However, when the Cypress Sandstone grades upward into heterolithic facies with a higher clay content (>10%), the model fails and produces negative values of ϕe. Failure of the ϕe model was expected because equation 6 was developed for reservoir sandstones. Although Hurst and Nadeau (1995) did not provide a clear definition of “reservoir sandstones,” they applied equation 6 to sandstone samples composed of 2% to 7% authigenic clay by weight. This study applies equation 6 only to Cypress Sandstone containing
The approximate 11% decrease in ϕe for Cypress Sandstone reservoirs is helpful for both well-log analysis and reservoir quality. The dual-water method relies on accurate values of ϕe and ϕm to estimate the resistivity of the free (formation) water and the bound (clay) water. Separating effective from total porosity through log analysis is difficult; therefore, clay constituents require detailed characterization to confidently estimate values of ϕe and ϕm for the dual-water method.
The reduction in ϕe is more pronounced if illite ϕm of 95% is assumed. Specifically, average ϕe is reduced to 11%, a decrease from total porosity of approximately 40%. Pallatt et al. (1984) illustrated that in sandstones containing filamentous illite, permeability measured from oven-dried samples was higher than permeability measured from preserved core samples. The discrepancy was explained by McHardy et al. (1982), who showed that originally ribbonlike filamentous illite can flatten against pore walls following air drying. Here, we demonstrate that ϕe corrections based on air-dried core could, like permeability, be erroneously high because an increase in illite microporosity of 32% (from 63% to 95%) produces a 40% decrease in ϕe. However, 95% illite microporosity is likely an overestimate for the Cypress because illite hairs were observed in only 35% of samples; XRD estimates also include the illite with detrital clasts.
CONCLUSIONS
Here, we present the results of microanalytical techniques from core and apply them to enhance the evaluation of a formation where core is not available. When SEM and XRD were used to estimate clay volume, water saturation and effective porosity proved valuable for assessing the fluvial facies of the Cypress Sandstone for potential ROZs.
Microporosity in eight clay morphologies and average microporosity values for four clay mineral constituents in the Cypress Sandstone were quantified by using analytical results from SEM. Kaolinite, chlorite, illite, and mixed-layer illite-smectite were found to have average microporosity values of 41%, 58%, 63%, and 65%, respectively. A value of 4% effective clay mineral volume for reservoirs of the Cypress Sandstone was calculated by using clay microporosity with XRD data.
When effective clay mineral volumes were compared to shale volume estimations from GR logs, the method of Stieber (1970) was shown to be the best predictor of clay volume. The constant value of 4% effective clay mineral volume was implemented in the dual-water method and compared to the variable volume of shale estimates in the dual-water method, all of which predicted a greater show of a potential ROZ than did the Archie equation (Archie, 1942). Additionally, an average decrease of approximately 11% in effective porosity was found by accounting for clay microporosity in measurements of total porosity from He-plug porosimetry. The percentage decrease in effective porosity is representative of reservoirs of the Cypress Sandstone and can be applied to reservoir-quality estimates and well-log analyses in analogous areas throughout the ILB.
Estimates of effective clay mineral volume, effective water saturation, and effective porosity in the case of 95% illite microporosity (from Hurst and Nadeau, 1995) show that uncertainty is introduced if air-dried core is used for microporosity measurements. Under the 95% illite microporosity assumption, average effective clay mineral volume in Cypress reservoirs is 8% and average effective porosity is 11%. In the case of effective water saturation, 95% illite microporosity predicted the same OWC depth as the curves produced from data-driven microporosity values and log-based shale volume (Stieber, 1970). We conclude that the methodology presented here is suitable for correcting water saturation in ROZs with low illite content (
Clay mineral data from this study confirmed the accuracy of methods for well-log analysis, which are required for identifying ROZs. Additionally, data from this study showed that accounting for clay microporosity in petrophysical models of water saturation may mean the difference in finding an ROZ. The correction factor for effective porosity will become vital if ROZs are identified because accurate estimates of the pore space contributing to fluid flow will be essential when evaluating the suitability of the Cypress Sandstone or analogous formations for CO2–EOR and storage.
APPENDIX 1: XRD METHODS
The following section describes the methodology applied for bulk powder and oriented clay XRD data in this study. Also presented are example XRD profiles from a sample depth and their corresponding bulk and clay mineralogy in weight percent.
BULK POWDER METHODOLOGY
Mineralogical analyses of the project samples were performed at the Illinois State Geological Survey by XRD methods within the Industrial Minerals section. For the XRD procedure, the samples were micronized in a McCrone micronizing mill with deionized water for 10 min. They were then transferred to a 50-ml centrifuge tube. The tubes were placed in a centrifuge for 20 min at 2000 rpm. The clear supernatant was poured off and the remaining material dried overnight in a low-temperature oven. This remaining sample was mixed lightly with a mortar and pestle and then packed into an end-loading sample holder as a random powder bulk pack. The random bulk pack was analyzed with a Scintag XDS2000 machine. Step-scanned data were collected from 2° to 60° 2θ with a fixed rate of 2°/min with a step size of 0.05°2θ for each sample at 40 kV and 30 mA (Hughes and Warren, 1989; Hughes et al., 1994). All resulting traces were analyzed using the semiquantitative data reduction software from Materials Data Inc. (MDI) (Livermore, California) known as Jade+.
ORIENTED CLAY METHODOLOGY
Samples were prepared via isolation of the less than 2-µm fraction with gravity settling and prepared as oriented aggregate (Hughes and Warren, 1989; Moore and Reynolds, 1997). The slides were analyzed with XRD under three different conditions: (1) air dried, (2) after 24 hr of ethylene glycol treatment, and (3) heated at 350°C for 1 hr. All the XRD analysis was performed using a Scintag XDS2000 machine using copper K-alpha radiation. The data were step scanned and collected from 2° to 34° 2θ with a fixed time of 2 s per 0.05°2θ for each sample at 40 kV and 30 mA (Hughes and Warren, 1989; Hughes et al., 1994). The semiquantitative data reduction software from MDI known as Jade 9+ was used to analyze all resulting traces.
EXAMPLE ANALYSIS
Below is a micronized bulk-pack profile (Figure 18A) and a Figure 18B) profile from a sample depth used in this study. Tables 4 and 5 provide quantitative bulk and clay mineralogy for the sample depth.
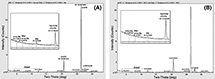 Figure 18. Example powder (micronized bulk pack [mbp]) and (A) clay-oriented (16GLY) (B) diffraction profiles for a sample depth from the C. T. Montgomery B-34 well (2585.5 ft; API 121592606400).


APPENDIX 2: MICROPOROSITY DETERMINATION USING IMAGE ANALYSIS IN PHOTOSHOP (FROM NADEAU AND HURST, 1991)
Here, we present an example of measuring microporosity with the BSE image analysis technique. The technique was originally developed by Nadeau and Hurst (1991). Below is a step-by-step procedure for capturing the proper image using an SEM and subsequent analysis in Photoshop.
THE SEM IMAGING PROCEDURE
1. Use an SEM to identify a region of the thin section that exhibits the clay mineral morphology of interest (Figure 19A).
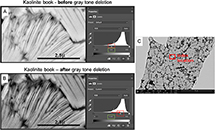 Figure 19. Example of microporosity determination via image analysis in Photoshop. Sample represents kaolinite books with 60% microporosity (0.6 volume fraction microporosity). (A) Backscattered electron (BSE) image before gray tone deletion. Gray tone levels are shown to the right. Note “1.00” centered below histogram, indicating 100% of gray tones are present. (B) A BSE image after gray tone deletion. Note “0.40” now displayed after right shifting the percentage adjuster to remove the lighter Z values (lower atomic numbers) that correspond to epoxy. Microporosity is then given by (1 – 0.40) = 0.60 = 60% microporosity. (C) A BSE image showing the index location of (A) and (B). Methodology is originally from Nadeau and Hurst (1991). det = detector; HV = high voltage; mag = magnification; RGB = red, green, blue; vCD = low voltage–high contrast detector; WD = working distance.
2. Increase magnification to image a region that contains the clay mineral of interest. Ensure no accessory minerals present (Figure 19B). Typically, the total area of analysis for clay microporosity should be less than 1 mm2, but in some cases, it may be larger for pore-filling morphologies (Hurst and Nadeau, 1995). Collect EDS data from a point on the clay mineral to confirm composition. Ensure imaging signal is of BSEs. Equalize contrast and brightness. Capture image.
PHOTOSHOP ANALYSIS PROCEDURE
1. Import photomicrograph into Photoshop. Ensure that only the photomicrograph is present because the presence of scale bars and the like will distort gray tone distribution.
2. Open the “Adjustments” and select “Levels.” A histogram of the gray tone distribution of the image will appear (output levels 0–255; Figure 19A, B). Readers are referred to Dilks and Graham (1985) for a general explanation of digital image analysis using gray-level classification.
3. Slide the adjustment arrow to the right to progressively delete lighter gray tones that represent epoxy (intercrystallite porosity of the clays). Continue until the analyst is satisfied that only mineral surfaces remain.
4. Record the percentage of gray tones deleted, determined as (1 − number centered below histogram) (Figure 19A, B). The determined number is equal to the microporosity as a volume fraction of the clay mineral morphology.
5. It is recommended to repeat steps 2–4 up to 50 times to ensure accuracy of the interpreter (Nadeau and Hurst, 1991. For a given clay morphology, visualize the standard deviation of the mean to ensure analytical precision.
REFERENCES CITED
Anjos, S. M. C., L. F. De Ros, and C. M. A. Silva, 2003, Chlorite authigenesis and porosity preservation in the Upper Cretaceous marine sandstones of the Santos Basin, offshore eastern Brazil: Ghent, Belgium, International Association of Sedimentologists Special Publication 34, p. 291–316.
Archie, G. E., 1942, The electrical resistivity log as an aid in determining some reservoir characteristics: Transactions of the AIME, v. 146, no. 1, p. 54–62, doi:10.2118/942054-G.
Berger, A., S. Gier, and P. Krois, 2009, Porosity-preserving chlorite cements in shallow-marine volcaniclastic sandstones: Evidence from Cretaceous sandstones of the Sawan gas field, Pakistan: AAPG Bulletin, v. 93, no. 5, p. 595–615, doi:10.1306/01300908096.
Berger, P. M., W. R. Roy, E. Mehnert, I. G. Krapac, B. Wimmer, and A. Iranmanesh, 2010, Impact of carbon dioxide sequestration on reservoir brine composition at an enhanced oil recovery site in Fayette County, Illinois: Champaign, Illinois, Illinois State Geological Survey Open-File Series 2010-1, 15 p.
Bloch, S., R. H. Lander, and L. M. Bonnell, 2002, Anomalously high porosity and permeability in deeply buried sandstone reservoirs: Origin and predictability: AAPG Bulletin, v. 86, no. 2, p. 301–328.
Boles, J. R., 1984, Secondary porosity reactions in the Stevens sandstone, San Joaquin Valley, California, in D. A. McDonald and R. C. Surdam, eds., Clastic diagenesis: AAPG Memoir 37, p. 217–224.
Boles, J. R., and S. G. Franks, 1979, Clay diagenesis in Wilcox sandstones of southwest Texas; Implications of smectite diagenesis on sandstone cementation: Journal of Sedimentary Petrology, v. 49, no. 1, p. 55–70.
Burton, J. H., D. H. Krinsley, and K. Pye, 1987, Authigenesis of kaolinite and chlorite in Texas Gulf Coast sediments: Clays and Clay Minerals, v. 35, no. 4, p. 291–296, doi:10.1346/CCMN.1987.0350406.
Byrnes, A. P., B. Seyler, and W. J. Guy, 1998, Petrophysics of the Aux Vases sandstone, southwest Illinois Basin: Kansas Geological Survey Petroleum Resources of the Aux Vases Sandstone Workshop, Marion, Illinois, March 25–26, 1998, p. E1–E28.
Carrigy, M. A., and G. B. Mellon, 1964, Authigenic clay mineral cements in Cretaceous and Tertiary sandstones of Alberta: Journal of Sedimentary Petrology, v. 34, no. 3, p. 461–472.
Caruso, L., G. Simmons, and R. Wilkens, 1985, The physical properties of a set of sandstones—Part I. The samples: International Journal of Rock Mechanics and Mining Sciences & Geomechanics Abstracts, v. 22, no. 6, p. 381–392.
Clavier, C., G. Coates, and J. Dumanoir, 1984, Theoretical and experimental bases for the dual-water model for interpretation of shaly sands: Society of Petroleum Engineers Journal, v. 24, no. 2, SPE-6859-PA, p. 153–168.
Clavier, C., W. Hoyle, and D. Meunier, 1971, Quantitative interpretation of thermal neutron decay time logs: Part I. Fundamentals and techniques: Journal of Petroleum Technology, v. 23, no. 6, p. 743–755, doi:10.2118/2658-A-PA.
Cole, R. D., and W. J. Nelson, 1995, Stratigraphic framework and environments of deposition of the Cypress Formation in the outcrop belt of southern Illinois: Champaign, Illinois, Illinois State Geological Survey Illinois Petroleum 149, 47 p.
Daigle, H., B. Ghanbarian, P. Henry, and M. Conin, 2015, Universal scaling of the formation factor in clays: Example from the Nankai Trough: Journal of Geophysical Research: Solid Earth, v. 120, no. 11, p. 7361–7375, doi:10.1002/2015JB012262.
Demir, I., and B. Seyler, 1999, Chemical composition and geologic history of saline waters in Aux Vases and Cypress Formations, Illinois Basin: Aquatic Geochemistry, v. 5, no. 3, p. 281–311, doi:10.1023/A:1009609619083.
De Ros, L. F., S. M. C. Anjos, and S. Morad, 1994, Authigenesis of amphibole and its relationship to the diagenetic evolution of Lower Cretaceous sandstones of the Potiguar rift basin, northeastern Brazil: Sedimentary Geology, v. 88, no. 3–4, p. 253–266, doi:10.1016/0037-0738(94)90065-5.
Desbois, G., J. L. Urai, P. A. Kukla, J. Konstanty, and C. Baerle, 2011, High-resolution 3D fabric and porosity model in a tight gas sandstone reservoir: A new approach to investigate microstructures from mm- to nm-scale combining argon beam cross-sectioning and SEM imaging: Journal of Petroleum Science Engineering, v. 78, no. 2, p. 243–257, doi:10.1016/j.petrol.2011.06.004.
Dewan, J. T., 1983, Essentials of modern open-hole log interpretation: Tulsa, Oklahoma, PennWell, 361 p.
Dilks, A., and S. C. Graham, 1985, Quantitative mineralogical characterization of sandstones by back-scattered electron image analysis: Journal of Sedimentary Petrology, v. 55, no. 3, p. 347–355.
Dolly, E. D., and J. C. Mullarkey, 1996, Hydrocarbon production from low contrast, low resistivity reservoirs, Rocky Mountain and mid-continent regions: Log examples of subtle plays: Denver, Colorado, Rocky Mountain Association of Geologists, 290 p.
Ehrenberg, S. N., P. Aagaard, M. J. Wilson, A. R. Fraser, and D. M. L. Duthie, 1993, Depth-dependent transformation of kaolinite to dickite in sandstones of the Norwegian continental shelf: Clay Minerals, v. 28, no. 3, p. 325–352, doi:10.1180/claymin.1993.028.3.01.
Goldstein, J. I., D. E. Newbury, J. R. Michael, N. W. Ritchie, J. H. J. Scott, and D. C. Joy, 2017, Scanning electron microscopy and x-ray microanalysis: Boston, Massachusetts, Springer, 690 p.
Grube, J. P., 1992, Reservoir characterization and improved oil recovery from multiple bar sandstones, Cypress Formation, Tamaroa and Tamaroa South fields, Perry County, Illinois: Champaign, Illinois, Illinois State Geological Survey Illinois Petroleum 138, 49 p.
Grube, J. P., and W. T. Frankie, 1999, Reservoir characterization and its application to improved oil recovery from the Cypress Formation (Mississippian) at Richview field: Champaign, Illinois, Illinois State Geological Survey Illinois Petroleum 155, 39 p.
Hillier, S., 1994, Pore-lining chlorites in siliciclastic reservoir sandstones: Electron microprobe, SEM and XRD data, and implications for their origin: Clay Minerals, v. 29, no. 4, p. 665–679, doi:10.1180/claymin.1994.029.4.20.
Holmes, M., A. Holmes, and D. Holmes, 2013, Examples to show the importance of using upscaled core data when comparing with petrophysical data: Society of Petrophysicists and Well Log Analysts 54th Annual Logging Symposium: New Orleans, Louisiana, June 22–26, 2013, SPWLA-2013-N, 8 p.
Hughes, R. E., D. M. Moore, and H. D. Glass, 1994, Qualitative and quantitative analysis of clay minerals in soils, in J. E. Amonette and L. W. Zelazny, eds., Quantitative methods in soil mineralogy: Madison, Wisconsin, Soil Science Society of America Miscellaneous Publication, p. 330–359.
Hughes, R. E., and R. L. Warren, 1989, Evaluation of the economic usefulness of earth materials by x-ray diffraction, in R. E. Hughes and J. C. Bradbury, eds., Proceedings of the 23rd Forum on the Geology of Industrial Minerals: North Aurora, Illinois, Illinois State Geological Survey Industrial Mineral Notes 102, p. 47–57.
Hurst, A., and P. Nadeau, 1995, Clay microporosity in reservoir sandstones: An application of quantitative electron microscopy in petrophysical evaluation: AAPG Bulletin, v. 79, no. 4, p. 563–573.
Kantorowicz, J. D., 1990, The influence of variations in illite morphology on the permeability of Middle Jurassic Brent Group sandstones, Cormorant Field, UK North Sea: Marine and Petroleum Geology, v. 7, no. 1, p. 66–74, doi:10.1016/0264-8172(90)90057-N.
Larionov, V. V., 1969, Borehole radiometry: Moscow, Russia, Nedra Publishers, 127 p.
Liu, C., B. Shi, J. Zhou, and C. Tang, 2011, Quantification and characterization of microporosity by image processing, geometric measurement and statistical methods: Application on SEM images of clay materials: Applied Clay Science, v. 54, no. 1, p. 97–106, doi:10.1016/j.clay.2011.07.022.
McHardy, W. J., M. J. Wilson, and M. Tait, 1982, Electron microscope and x-ray diffraction studies of filamentous illitic clay from sandstones of the Magnus field: Clay Minerals, v. 17, no. 1, p. 23–40, doi:10.1180/claymin.1982.017.1.04.
Moore, D. M., and R. E. Hughes, 1991, Varieties of chlorites and illites and porosity in Mississippian sandstone reservoirs in the Illinois Basin (abs.): AAPG Annual Convention, Dallas, Texas, April 7–10, 1991, accessed December 11, 2015, http://www.searchanddiscovery.com/abstracts/html/1991/annual/abstracts/0639a.htm.
Moore, D. M., and R. C. Reynolds Jr., 1997, X-ray diffraction and the identification and analysis of clay minerals, 2nd ed.: New York, Oxford University Press, 400 p.
Moraes, M. A. S., and L. F. de Ros, 1990, Infiltrated clays in fluvial Jurassic sandstones of Reconcavo Basin, northeastern Brazil: Journal of Sedimentary Petrology, v. 60, no. 6, p. 809–819.
Nabawy, B. S., Y. Geraud, P. Rochette, and N. Bur, 2009, Pore-throat characterization in highly porous and permeable sandstones: AAPG Bulletin, v. 93, no. 6, p. 719–739, doi:10.1306/03160908131.
Nadeau, P. H., and A. Hurst, 1991, Application of back-scattered electron microscopy to the quantification of clay mineral microporosity in sandstones: Journal of Sedimentary Research, v. 61, no. 6, p. 921–925.
Nelson, W. J., L. B. Smith, and J. D. Treworgy, 2002, Sequence stratigraphy of the Lower Chesterian (Mississippian) strata of the Illinois Basin: Champaign, Illinois, Illinois State Geological Survey Bulletin 107, 70 p.
Pallatt, N., and D. Thornley, 1990, The role of bound water and capillary water in the evaluation of porosity in reservoir rocks, in P. F. Worthington, ed., Advances in core evaluation: Accuracy and precision in reserves estimation: London, United Kingdom, Gordon and Breach Science Publishers, p. 21–23.
Pallatt, N., J. Wilson, and B. McHardy, 1984, The relationship between permeability and the morphology of diagenetic illite in reservoirs rocks: Journal of Petroleum Technology, v. 36, no. 12, SPE-12798-PA, p. 2225–2227, doi:10.2118/12798-PA.
Pitman, J. K., M. Henry, and B. Seyler, 1998, Reservoir quality and diagenetic evolution of Upper Mississippian rocks in the Illinois Basin: Influence of a regional hydrothermal fluid-flow event during late diagenesis: Reston, Virginia, US Geological Survey Professional Paper 1597, 25 p.
Pittman, E. D., 1979, Porosity, diagenesis, and productive capability of sandstone reservoirs: Tulsa, Oklahoma, SEPM Special Publication 26, p. 159–173.
Pittman, E. D., and J. B. Thomas, 1979, Some applications of scanning electron microscopy to the study of reservoir rock: Journal of Petroleum Technology, v. 31, no. 11, p. 1375–1380, doi:10.2118/7550-PA.
Rahim, N., and N. Watson, 2015, Determination of Duvernay Formation reservoir properties through probabilistic petrophysical analysis calibrated to core studies: GeoConvention 2015, Calgary, Alberta, Canada, May 4–8, 2015, 8 p.
Salem, A. M., J. M. Ketzer, S. Morad, R. R. Rizk, and I. Al-Aasm, 2005, Diagenesis and reservoir-quality evolution of incised-valley sandstones: Evidence from the Abu Madi gas reservoirs (Upper Miocene), the Nile Delta Basin, Egypt: Journal of Sedimentary Research, v. 75, no. 4, p. 572–584, doi:10.2110/jsr.2005.047.
Sardini, P., A. El Albani, D. Pret, S. Gaboreau, M. Siitari-Kauppi, and D. Beaufort, 2009, Mapping and quantifying the clay aggregate microporosity in medium- to coarse-grained sandstones using the 14C-PMMA method: Journal of Sedimentary Research, v. 79, no. 8, p. 584–592, doi:10.2110/jsr.2009.063.
Seyler, B., J. P. Grube, and D. G. Morse, 2000, The Cypress Sandstone in Illinois: Petroleum Technology Transfer Council Cypress Sandstone Workshop, Mount Vernon, Illinois, April 5, 2000, 157 p.
Sloss, L. L., 1963, Sequences in the cratonic interior of North America: Geological Society of America Bulletin, v. 74, no. 2, p. 93–114, doi:10.1130/0016-7606(1963)74[93:SITCIO]2.0.CO;2.
Smith, L. B. Jr., and J. F. Read, 2001, Discrimination of local and global effects on Upper Mississippian stratigraphy, Illinois Basin, U.S.A.: Journal of Sedimentary Research, v. 71, no. 6, p. 985–1002, doi:10.1306/040501710985.
Solymar, M., and I. L. Fabricius, 1999, Image analysis and estimation of porosity and permeability of Arnager Greensand, Upper Cretaceous, Denmark: Physics and Chemistry of the Earth, v. 24, no. 7, p. 587–591, doi:10.1016/S1464-1895(99)00084-8.
Spooner, P., 2014, Lifting the fog of confusion surrounding clay and shale in petrophysics: Society of Petrophysicists and Well Log Analysts 55th Annual Logging Symposium, Abu Dhabi, United Arab Emirates, May 18–22, 2014, SPWLA-2014-VV, accessed March 2, 2016, https://www.onepetro.org/download/conference-paper/SPWLA-2014-VV?id=conference-paper%2FSPWLA-2014-VV.
Stieber, S. J., 1970, Pulsed neutron capture log evaluation—Louisiana Gulf Coast: Fall Meeting of the Society of Petroleum Engineers of American Institute of Mining, Metallurgical, and Petroleum Engineers, Houston, Texas, October 4–7, 1970, accessed February 19, 2016, SPE-2961-MS, https://www.onepetro.org/download/conference-paper/SPE-2961-MS?id=conference-paper%2FSPE-2961-MS.
Ugbo, J., 2007, Water saturation evaluation in shaly sand reservoirs using advanced x-ray diffraction and cation exchange capacity measurements: Society of Petroleum Engineers Annual Technical Conference and Exhibition, Anaheim, California, November 11–14, 2007, SPE-113031-STU, doi:10.2118/113031-STU.
Walker, T. R., B. Waugh, and A. J. Grone, 1978, Diagenesis in first-cycle desert alluvium of Cenozoic age, southwestern United States and northwestern Mexico: Geological Society of America Bulletin, v. 89, no. 1, p. 19–32, doi:10.1130/0016-7606(1978)89<19:DIFDAO>2.0.CO;2.
Waxman, M. H., and L. J. M. Smits, 1968, Electrical conductivities in oil-bearing shaly sands: Society of Petroleum Engineers Journal, v. 8, no. 2, p. 107–122, doi:10.2118/1863-A.
Webb, N. D., and Grigsby, N. P., 2020, Assessing the Cypress Sandstone for carbon dioxide–enhanced oil recovery and carbon storage: Part I—Reservoir characterization of Noble oil field, Western Richland County, Illinois: Champaign, Illinois, Illinois State Geological Survey Circular 601, 53 p.
Welton, J. E., 1984, Illite, in J. E. Welton, ed., SEM petrology atlas: AAPG Methods in Exploration Series 4, p. 47–55.
Whitaker, S. T., and A. K. Finley, 1992, Reservoir heterogeneity and potential for improved oil recovery within the Cypress Formation at Bartelso field, Clinton County, Illinois: Champaign, Illinois, Illinois State Geological Survey Illinois Petroleum 137, 40 p.
Wilson, M. D., 1992, Inherited grain-rimming clays in sandstones from eolian and shelf environments: Their origin and control on reservoir properties, in D. W. Houseknecht and E. D. Pittman, eds., Origin, diagenesis, and petrophysics of clay minerals in sandstones: Tulsa, Oklahoma, SEPM Special Publication 47, p. 209–225, doi:10.2110/pec.92.47.0209.
Wilson, M. J., L. Wilson, I. Patey, and H. Shaw, 2014, The influence of individual clay minerals on formation damage of reservoir sandstones: A critical review with some new insights: Clay Minerals, v. 49, no. 2, p. 147–164, doi:10.1180/claymin.2014.049.2.02.
Worden, R. H., and S. D. Burley, 2003, Sandstone diagenesis: The evolution of sand to stone, in S. D. Burley and R. H. Worden, eds., Sandstone diagenesis: Recent and ancient: Oxford, United Kingdom, Blackwell Publishing, p. 1–44, doi:10.1002/9781444304459.ch.
Worthington, P. F., 2003, Effect of clay content upon some physical properties of sandstone reservoirs, in R. H. Worden and S. Morad, eds., Clay mineral in sandstones: Ghent, Belgium, International Association of Sedimentologists Special Publication 34, p. 191–211.
Xu, J., and B. G. Huff, 1995, Cypress Sandstone (Mississippian) reservoir and its recovery potential at Xenia East oil field, Clay County, Illinois: Champaign, Illinois, Illinois State Geological Survey Illinois Petroleum 147, 47 p.
Yadav, L., and T. Das, 2015, New concept of variable Archie bound water exponent for the evaluation of low resistivity pays in Mesozoic fluvial reservoirs of Krishna Godavari Basin, east coast, India: Society of Petroleum Geophysicists 11th Biennial International Conference and Exposition, Jaipur, India, December 4–6, 2015, 6 p., accessed August 6, 2016, https://www.spgindia.org/11_biennial_form/new-concept-of-variable-archie-bound-water-exponent-for-the-evaluation-of-low-resistivity-pays-in-mesozoic-fluvial-reservoirs-of-krishna-godavari-basin-east-coast-india-jaipur-2015.pdf.
Zhang, Y., G. Pe-Piper, and D. J. W. Piper, 2015, How sandstone porosity and permeability vary with diagenetic minerals in the Scotian Basin, offshore eastern Canada: Implications for reservoir quality: Marine and Petroleum Geology, v. 63, p. 28–45, doi:10.1016/j.marpetgeo.2015.02.007.
AUTHORS
Leo G. Giannetta received his M.S. degree in geology (2019) from California State University, Long Beach, with an emphasis on mudstone sedimentology and stratigraphy. He currently works as an earth scientist at Chevron in Bakersfield, California. Prior to his M.S. degree, he was a researcher at the Illinois State Geological Survey where he focused on clay mineralogy and diagenesis to support enhanced oil recovery and geologic storage of CO2. He is a Licensed Professional Geologist in the state of California.
Nathan D. Webb received his M.S. degree in geology in 2009 from the University of Illinois at Urbana-Champaign. He is currently an associate research scientist and petroleum geologist at the Illinois State Geological Survey. His research interests include sedimentology, stratigraphy, and reservoir characterization for enhanced oil recovery and geologic storage of CO2.
Shane K. Butler received his M.S. degree in 2017 from the University of Illinois at Urbana-Champaign. He is currently a principal geologist at the EERC in Grand Forks, North Dakota, where he performs and interprets chemical and mineralogical analyses of rocks, clay, coal, and other materials to develop and advance analytical techniques related to unconventional oil and gas reservoirs, shales, and other tight formations for federal, state, and commercial clients. Prior to his position at the EERC, he served as a geologic specialist with the Illinois State Geological Survey.
Nate P. Grigsby received his M.S. degree in earth and environmental sciences in 2012 from Wright State University. He is currently an assistant geologist at the Illinois State Geological Survey. His research interests include well-log analysis techniques, geocellular modeling, and geostatistics.
ACKNOWLEDGMENTS
The research herein was supported by the US Department of Energy under contract number DE-FE0024431. Special thanks are extended to Scott Robinson, Cate Wallace, and the Imaging Technology Group at the Beckman Institute, University of Illinois at Urbana-Champaign, for assistance with and access to the environmental scanning electron microscope field emission gun instrument. The authors also thank Wagner Petrographic for preparing the high-quality thin sections. The authors greatly appreciate the reviews of this paper by John Grube, Randy Hughes (clay mineralogy), and Scott Frailey (well-log analysis), as well as the scientific guidance and editorial integrity contributed by the knowledgeable staff at the Illinois State Geological Survey.