The AAPG/Datapages Combined Publications Database
AAPG Bulletin
Figure
AAPG Bulletin; Year: 2021; Issue: August DOI: 10.1306/02262118214
Return to Full Text
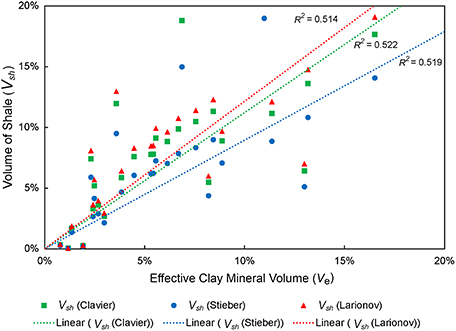
Figure 15.
An x,y plot showing the correlation strengths between Ve and the three gamma-ray Vsh methods. The coefficient of determination (R2) denotes the accuracy of each Vsh method as a predictor of clay volume. Data taken from Figure 14. From the John O. Coen 120 well (API 121592608300, Section 4, T3N, R9E).
Figure 15. An x,y plot showing the correlation strengths between Ve and the three gamma-ray Vsh methods. The coefficient of determination (R2) denotes the accuracy of each Vsh method as a predictor of clay volume. Data taken from Figure 14. From the John O. Coen 120 well (API 121592608300, Section 4, T3N, R9E).