The AAPG/Datapages Combined Publications Database
AAPG Bulletin
Figure
AAPG Bulletin; Year: 2021; Issue: August DOI: 10.1306/02262118214
Return to Full Text
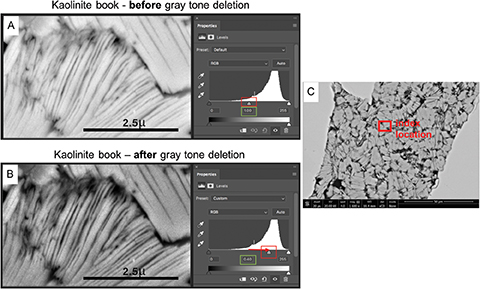
Figure 19.
Example of microporosity determination via image analysis in Photoshop. Sample represents kaolinite books with 60% microporosity (0.6 volume fraction microporosity). (A) Backscattered electron (BSE) image before gray tone deletion. Gray tone levels are shown to the right. Note “1.00” centered below histogram, indicating 100% of gray tones are present. (B) A BSE image after gray tone deletion. Note “0.40” now displayed after right shifting the percentage adjuster to remove the lighter Z values (lower atomic numbers) that correspond to epoxy. Microporosity is then given by (1 – 0.40) = 0.60 = 60% microporosity. (C) A BSE image showing the index location of (A) and (B). Methodology is originally from Nadeau and Hurst (1991 ). det = detector; HV = high voltage; mag = magnification; RGB = red, green, blue; vCD = low voltage–high contrast detector; WD = working distance.
Figure 19.
Example of microporosity determination via image analysis in Photoshop. Sample represents kaolinite books with 60% microporosity (0.6 volume fraction microporosity). (A) Backscattered electron (BSE) image before gray tone deletion. Gray tone levels are shown to the right. Note “1.00” centered below histogram, indicating 100% of gray tones are present. (B) A BSE image after gray tone deletion. Note “0.40” now displayed after right shifting the percentage adjuster to remove the lighter Z values (lower atomic numbers) that correspond to epoxy. Microporosity is then given by (1 – 0.40) = 0.60 = 60% microporosity. (C) A BSE image showing the index location of (A) and (B). Methodology is originally from