The AAPG/Datapages Combined Publications Database
AAPG Bulletin
Figure
AAPG Bulletin; Year: 2021; Issue: August DOI: 10.1306/02262118214
Return to Full Text
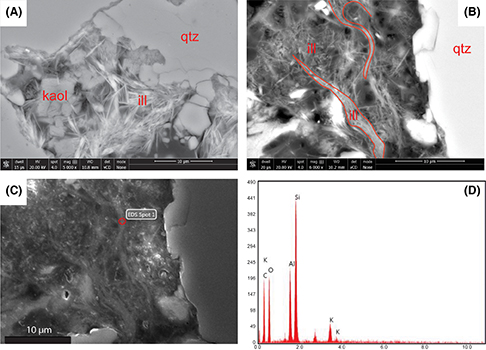
Figure 7.
Backscattered electron (BSE) and scanning electron microscopy (SEM) images and energy-dispersive x-ray spectroscopy (EDS) spectrum of authigenic illite (ill). (A) A BSE image of pore-filling mats of intertwined needle ill occurring with blocky kaolinite (kaol). Magnification (mag) 5000×. (B) A BSE image of pore-lining and pore-bridging ribbons of hairy ill. Red lines outline prominent hairs. The mag is 6000×. (C) The SEM image corresponding to (B) taken by the EDAX image collector. (D) The EDS spectrum of typical authigenic ill in the Cypress Sandstone taken from a point (“EDS Spot 1”) on image (C). Major elemental peaks of Al, Si, and K and minor peaks of Mg, Ca, and Fe (not labeled) reflect the chemical formula of ill ((K, H3O)(Al, Mg, Fe)2(Si, Al)4O10[(OH)2,(H2O)]). The high C peak is the result of C coating during sample preparation. det = detector; HV = high voltage; qtz = quartz; vCD = low voltage–high contrast detector; WD = working distance.
Figure 7. Backscattered electron (BSE) and scanning electron microscopy (SEM) images and energy-dispersive x-ray spectroscopy (EDS) spectrum of authigenic illite (ill). (A) A BSE image of pore-filling mats of intertwined needle ill occurring with blocky kaolinite (kaol). Magnification (mag) 5000×. (B) A BSE image of pore-lining and pore-bridging ribbons of hairy ill. Red lines outline prominent hairs. The mag is 6000×. (C) The SEM image corresponding to (B) taken by the EDAX image collector. (D) The EDS spectrum of typical authigenic ill in the Cypress Sandstone taken from a point (“EDS Spot 1”) on image (C). Major elemental peaks of Al, Si, and K and minor peaks of Mg, Ca, and Fe (not labeled) reflect the chemical formula of ill ((K, H3O)(Al, Mg, Fe)2(Si, Al)4O10[(OH)2,(H2O)]). The high C peak is the result of C coating during sample preparation. det = detector; HV = high voltage; qtz = quartz; vCD = low voltage–high contrast detector; WD = working distance.