The AAPG/Datapages Combined Publications Database
AAPG Bulletin
Figure
AAPG Bulletin; Year: 2021; Issue: October DOI: 10.1306/04232120046
Return to Full Text
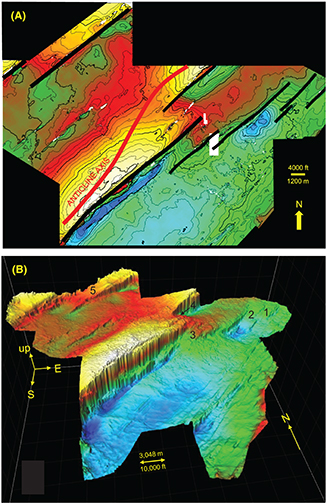
Figure 4.
(A) Time-structure map on the Devonian Onondaga Limestone in a three-dimensional (3-D) seismic survey. The seismic survey is located within the white dashed polygon in Pennsylvania in Figure 1. Northeast-striking black lines indicate major faults at the Onondaga Limestone level. Anticline axis (red line) that is mapped in the near-surface and surface Carboniferous coal measures (more than 1 mi [>1.6 km] above the Onondaga surface) swings from one Onondaga anticline to the next. Contour interval is 8 ms (∼17 m [∼56 ft]). The color ramp is from white and yellow = high to blue = low. The small white blocks in the image are areas of no data (“cut-outs”). (B) Isometric view of the Onondaga Limestone surface shown in (A), looking north. Significant relay ramps are numbered 1–5. The number 4 refers to the relay ramp partially hidden in this isometric view. The 3-D seismic survey is located within the white dashed polygon in Pennsylvania in Figure 1. Horizontal scale is correct at the front of the isometric view. The vertical “up” arrow is approximately 175 m (∼575 ft) in the approximate center of the isometric view. This surface is in the depth domain. The depth domain was calculated by using well ties between formation tops and interpreted horizons to build a velocity model that allowed us to convert the time domain (in (A)) to depth (B).
Figure 4. (A) Time-structure map on the Devonian Onondaga Limestone in a three-dimensional (3-D) seismic survey. The seismic survey is located within the white dashed polygon in Pennsylvania in Figure 1. Northeast-striking black lines indicate major faults at the Onondaga Limestone level. Anticline axis (red line) that is mapped in the near-surface and surface Carboniferous coal measures (more than 1 mi [>1.6 km] above the Onondaga surface) swings from one Onondaga anticline to the next. Contour interval is 8 ms (∼17 m [∼56 ft]). The color ramp is from white and yellow = high to blue = low. The small white blocks in the image are areas of no data (“cut-outs”). (B) Isometric view of the Onondaga Limestone surface shown in (A), looking north. Significant relay ramps are numbered 1–5. The number 4 refers to the relay ramp partially hidden in this isometric view. The 3-D seismic survey is located within the white dashed polygon in Pennsylvania in Figure 1. Horizontal scale is correct at the front of the isometric view. The vertical “up” arrow is approximately 175 m (∼575 ft) in the approximate center of the isometric view. This surface is in the depth domain. The depth domain was calculated by using well ties between formation tops and interpreted horizons to build a velocity model that allowed us to convert the time domain (in (A)) to depth (B).