The AAPG/Datapages Combined Publications Database
AAPG Bulletin
Figure
AAPG Bulletin; Year: 2021; Issue: October DOI: 10.1306/04232120046
Return to Full Text
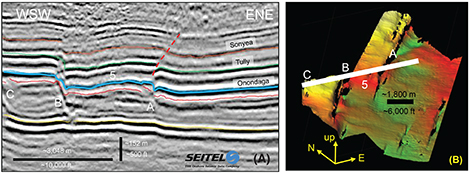
Figure 5.
(A) Dip section in the three-dimensional (3-D) seismic survey across faults in the westernmost part of the 3-D seismic survey (for location see (B)). The three labeled faults (A–C) appear to be normal faults, and the throw on fault B is approximately 40 ms. (∼85 m [∼280 ft]). The normal fault locations are denoted in (B). The number 5 indicates relay ramp 5 in Figure 4B. A selected thrust fault is marked by the red dashed line; this fault has an apparent dip of approximately 16° and a true dip of approximately 28°. The thrust offsets the Tully and Sonyea reflectors. Seismic data used in this interpretation are courtesy of and owned by Seitel. (B) Locations of the three faults (A–C) and the seismic section that are displayed in (A) are shown on an isometric view of the northwestern part of the Onondaga surface that is displayed in Figure 4B. Fault A is the southeastern boundary fault of relay ramp 5 in Figure 4B and (A) and (B).
Figure 5. (A) Dip section in the three-dimensional (3-D) seismic survey across faults in the westernmost part of the 3-D seismic survey (for location see (B)). The three labeled faults (A–C) appear to be normal faults, and the throw on fault B is approximately 40 ms. (∼85 m [∼280 ft]). The normal fault locations are denoted in (B). The number 5 indicates relay ramp 5 in Figure 4B. A selected thrust fault is marked by the red dashed line; this fault has an apparent dip of approximately 16° and a true dip of approximately 28°. The thrust offsets the Tully and Sonyea reflectors. Seismic data used in this interpretation are courtesy of and owned by Seitel. (B) Locations of the three faults (A–C) and the seismic section that are displayed in (A) are shown on an isometric view of the northwestern part of the Onondaga surface that is displayed in Figure 4B. Fault A is the southeastern boundary fault of relay ramp 5 in Figure 4B and (A) and (B).