The AAPG/Datapages Combined Publications Database
AAPG Bulletin
Figure
AAPG Bulletin; Year: 2021; Issue: October DOI: 10.1306/04232120046
Return to Full Text
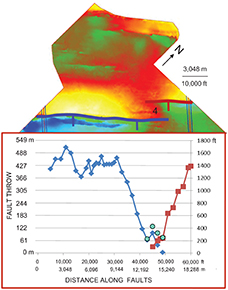
Figure 6.
Profiles of fault throw. The upper panel shows the color-coded fault locations and relay ramp no. 4 on the time-structure map of the Devonian Onondaga Limestone; this map is the central and northwestern parts of Figure 4A. The color ramp is from white and yellow = high to blue = low. The lower panel displays the profiles of fault throw along the strike of the two color-coded faults linked by relay ramp no. 4. The azure blue circles indicate the cumulative throw of the red and blue faults in the region of the relay ramp.
Figure 6. Profiles of fault throw. The upper panel shows the color-coded fault locations and relay ramp no. 4 on the time-structure map of the Devonian Onondaga Limestone; this map is the central and northwestern parts of Figure 4A. The color ramp is from white and yellow = high to blue = low. The lower panel displays the profiles of fault throw along the strike of the two color-coded faults linked by relay ramp no. 4. The azure blue circles indicate the cumulative throw of the red and blue faults in the region of the relay ramp.