The AAPG/Datapages Combined Publications Database
AAPG Bulletin
Figure
AAPG Bulletin; Year: 2021; Issue: October DOI: 10.1306/04232120046
Return to Full Text
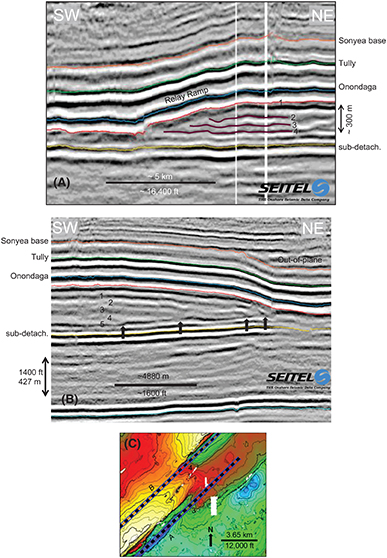
Figure 8.
(A) Longitudinal (strike) seismic slice in the three-dimensional (3-D) seismic survey along the length of the relay ramp labeled no. 3 in Figure 4B. See (C) for the location of the line of section. In the relay ramp, the positive reflector directly below no. 1 truncates reflectors no. 2, 3, and 4; more material was removed upsection toward the upper (northeast) end of the ramp, as could be expected in normal erosion or slump scars. The detachment marking the zone of removal in this case climbs up section at the relay ramp along the positive reflector below no. 1. The subdetachment reflector (labeled “sub-detach.”) is approximately at the Lockport Group reflector. Seismic data used in this interpretation are courtesy of and owned by Seitel. (B) Longitudinal (strike) seismic slice along the length of the relay ramp labeled no. 4 in Figure 4B. See (C) for the location of the line-of-seismic section. In the relay ramp, the positive reflectors no. 1 to 4 structurally downlap onto reflector no. 5 at the vertical arrows. More material (areally) was removed downsection toward the upper (southwest) end of the ramp, as in a turtle structure. The detachment marking the zone of removal at the relay ramp (reflector no. 5) parallels the subdetachment reflector (labeled “sub-detach.”). Truncated reflectors in the upper right represent complex geometry of out-of-plane layers and faults that dip orthogonally to the seismic section and that intersect the seismic section. Seismic data used in this interpretation are courtesy of and owned by Seitel. (C) Locations of the longitudinal sections (thick, dashed, black lines) in (A) and (B) (italicized letters on map refer to (A) and (B), respectively). Numbers 3 and 4 refer to relay ramps no. 3 and 4 in the 3-D seismic survey displayed in Figure 4B. Map base is the central part of Figure 4A. Color ramp is warm colors = highs, cool colors = lows. The small white blocks in the image are areas of no data (“cut-outs”).
Figure 8. (A) Longitudinal (strike) seismic slice in the three-dimensional (3-D) seismic survey along the length of the relay ramp labeled no. 3 in Figure 4B. See (C) for the location of the line of section. In the relay ramp, the positive reflector directly below no. 1 truncates reflectors no. 2, 3, and 4; more material was removed upsection toward the upper (northeast) end of the ramp, as could be expected in normal erosion or slump scars. The detachment marking the zone of removal in this case climbs up section at the relay ramp along the positive reflector below no. 1. The subdetachment reflector (labeled “sub-detach.”) is approximately at the Lockport Group reflector. Seismic data used in this interpretation are courtesy of and owned by Seitel. (B) Longitudinal (strike) seismic slice along the length of the relay ramp labeled no. 4 in Figure 4B. See (C) for the location of the line-of-seismic section. In the relay ramp, the positive reflectors no. 1 to 4 structurally downlap onto reflector no. 5 at the vertical arrows. More material (areally) was removed downsection toward the upper (southwest) end of the ramp, as in a turtle structure. The detachment marking the zone of removal at the relay ramp (reflector no. 5) parallels the subdetachment reflector (labeled “sub-detach.”). Truncated reflectors in the upper right represent complex geometry of out-of-plane layers and faults that dip orthogonally to the seismic section and that intersect the seismic section. Seismic data used in this interpretation are courtesy of and owned by Seitel. (C) Locations of the longitudinal sections (thick, dashed, black lines) in (A) and (B) (italicized letters on map refer to (A) and (B), respectively). Numbers 3 and 4 refer to relay ramps no. 3 and 4 in the 3-D seismic survey displayed in Figure 4B. Map base is the central part of Figure 4A. Color ramp is warm colors = highs, cool colors = lows. The small white blocks in the image are areas of no data (“cut-outs”).