The AAPG/Datapages Combined Publications Database
AAPG Bulletin
Figure
AAPG Bulletin; Year: 2022; Issue: March DOI: 10.1306/07132120084
Return to Full Text
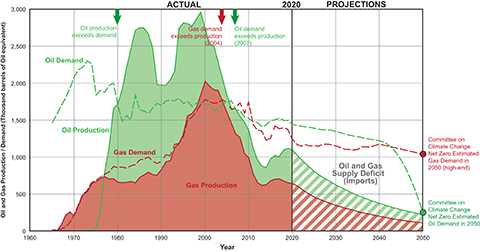
Figure 36.
Cumulative production curves for the United Kingdom and Norway for the period 1965–2050 showing how the peak in their production occurred around the turn of the Century. It is evident from the graph that the North Sea Super Basin is largely on a path of decline. Mature field management, near-field, and infrastructure-led exploration opportunities are likely to have primacy and may help reduce the rate of decline. The plot also shoes the production forecast for the UK out to 2050 and the roadmap to achieve zero net emissions. The tension between a demand to address carbon emissions and the need to continue to fuel a part of the economy through some, albeit less, oil and gas means that there will be an inevitable and increasing need for the United Kingdom to import from external sources, something that would lead to an increase in the country's carbon footprint.
Figure 36. Cumulative production curves for the United Kingdom and Norway for the period 1965–2050 showing how the peak in their production occurred around the turn of the Century. It is evident from the graph that the North Sea Super Basin is largely on a path of decline. Mature field management, near-field, and infrastructure-led exploration opportunities are likely to have primacy and may help reduce the rate of decline. The plot also shoes the production forecast for the UK out to 2050 and the roadmap to achieve zero net emissions. The tension between a demand to address carbon emissions and the need to continue to fuel a part of the economy through some, albeit less, oil and gas means that there will be an inevitable and increasing need for the United Kingdom to import from external sources, something that would lead to an increase in the country's carbon footprint.