The AAPG/Datapages Combined Publications Database
AAPG Bulletin
Figure
AAPG Bulletin; Year: 2022; Issue: April DOI: 10.1306/EG.01072120005
Return to Full Text
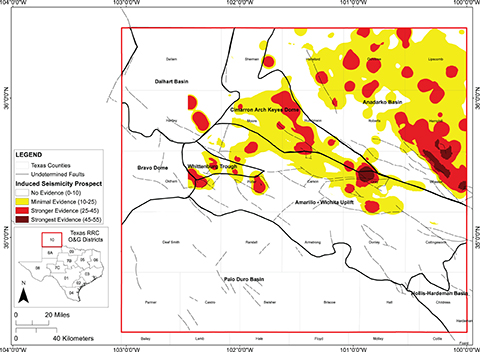
Figure 10.
Map showing prospect regions following the proposed modification of the Frohlich et al. (2016a, b) methods. Dashed lines depict basement-rooted faults with undetermined geometry taken from Ewing (1990). O&G = oil and gas; RRC = Railroad Commission of Texas.
Figure 10. Map showing prospect regions following the proposed modification of the Frohlich et al. (2016a, b) methods. Dashed lines depict basement-rooted faults with undetermined geometry taken from Ewing (1990). O&G = oil and gas; RRC = Railroad Commission of Texas.