The AAPG/Datapages Combined Publications Database
AAPG Bulletin
Full Text
![]() Click to view page images in PDF format.
Click to view page images in PDF format.
AAPG Bulletin, V.
DOI: 10.1306/EG.01072120005
Analysis of wastewater injection and prospect regions for induced seismicity in the Texas panhandle, United States
Juan P. Acevedo,1 Casee R. Lemons,2 Michael H. Young,3 Guin McDaid,4 and Bridget R. Scanlon5
1Texas Water Development Board, Austin, Texas; [email protected]
2Sourcewater, Inc., Houston, Texas; [email protected]
3Bureau of Economic Geology, UT Austin, Austin, Texas; [email protected]
4Bureau of Economic Geology, UT Austin, Austin, Texas; [email protected]
5Bureau of Economic Geology, UT Austin, Austin, Texas; [email protected]
ABSTRACT
Subsurface injection of wastewater, coproduced with oil and gas, has been linked to an increasing number of earthquakes throughout the southern midcontinent of the United States. This study aims to compare subsurface injection of produced water to the increased number of earthquakes in the panhandle region of Texas. For this study, saltwater disposal and enhanced oil recovery through underground injection control wells were analyzed from 1983 to 2018. During this period, 64 earthquakes of magnitude ≥2.5 were recorded. Average earthquake rates increased from 1.21 earthquakes per year (1983–2007) to 3.50 earthquakes per year (2008–2018). A total of 2.26 billion bbl of wastewater was injected into 34 geologic stratigraphic formations through 1926 active underground injection control wells in the study area. Disposal zones were concentrated in a few geographic regions and geologic formations. Approximately 1.96 billion bbl (87% of total) of wastewater was injected into seven geologic formations, including the igneous Precambrian basement; another 27 formations each received less than 100 million bbl. Results indicate that 61% of earthquakes have minimal or stronger evidence of being induced by a combination of underground injection control and oil and gas practices. Additionally, this research identified regions where future earthquakes could be induced by current underground injection control and oil and gas operations. Understanding how and where underground injection control and oil and gas operations are affecting seismicity rates in Texas can allow researchers, regulators, and operators to propose strategies to reduce or mitigate induced seismicity.
INTRODUCTION
Earthquakes have occurred in the state of Texas throughout its history, with historical earthquake data in the Texas panhandle recorded as early as 1907 (Davis, 1985; Frohlich and Davis, 2002). However, seismic activity has increased since around 2008, particularly in areas where oil and gas (O&G) production is underway in the Permian Basin, Barnett Shale play, Eagle Ford play, the East Texas Basin, and the Texas panhandle (Ellsworth, 2013; Keranen et al., 2013, 2014; Rubinstein and Mahani, 2015; Frohlich et al., 2016a; Kroll et al., 2017; Hincks et al., 2018; Hosseini et al., 2018; Kim and Lu, 2018; Rathje et al., 2018; Shapiro, 2018; Walter et al., 2018; Lemons et al., 2019; Pollyea et al., 2019; Quinones et al., 2019; Scanlon et al., 2019). Although they do occur naturally in Texas, many recent earthquakes are posited to be associated with O&G operations, whether by production of O&G or water, injection of water for hydraulic fracturing, fluid injection for pressure maintenance, saltwater disposal (SWD), or enhanced oil recovery (EOR), also known as “secondary recovery.” These earthquakes are commonly referred to as induced earthquakes or induced seismicity (Ellsworth, 2013; Frohlich et al., 2016a; Doglioni, 2017; Hincks et al., 2018; Walter et al., 2018; DeShon et al., 2019; Hennings et al., 2019; Lemons et al., 2019). Earthquakes in Texas have been studied comprehensively to understand whether, where, and when manmade practices from O&G operations could have caused them (cf., Frohlich and Davis, 2002; Frohlich et al., 2016a; Walter et al., 2018). Frohlich and Davis (2002) provided a historical understanding of Texas earthquakes and indicated that no earthquakes were recorded before 1907 in the Texas panhandle. The occurrence of earthquakes in this region coincided with the discovery of petroleum, which has led to speculation that earthquakes in this region were induced (Frohlich and Davis, 2002). However, Frohlich and Davis (2002) was published before hydraulic fracturing became a widespread practice (around 2008). As earthquakes continued to rise throughout Texas, geoscientists intensified studies on the relationship of these earthquakes and the increased O&G activity. Frohlich et al. (2016a) reported on an approach that categorized earthquakes as “naturally occurring,” “possibly induced,” “probably induced,” or “almost certainly induced” by O&G operations, using a qualitative score. Though relatively simple to apply, one drawback of the approach, noted by Everley (2016), was the lack of subsurface pressure or potential fluid movement in the assessment. Frohlich et al. (2016b) noted the paucity of subsurface pressure data in general, and the local nature of it, but agreed that modifying the categories was appropriate (from “naturally occurring” to “no evidence,” from “possibly induced” to “minimal evidence,” from “probably induced” to “stronger evidence,” and from “almost certainly induced” to “strongest evidence”). Walter et al. (2018) used the same methodology to characterize the nature of earthquakes in the Texas and Oklahoma panhandle area up to 2016. Their study demonstrated how the increase in seismic activity in the panhandle coincided with an increase in overall O&G activity, including energy production and wastewater injection operations.
This study will combine a comprehensive geologic study and an analysis of fluid injection practices in the Texas panhandle and identify the target formations receiving wastewater injectate following the same methodology of Frohlich et al. (2016a) and Walter et al. (2018). This approach will include earthquakes of magnitude (M) ≥2.5 that occurred during the years up to 2018. Finally, this study will identify the regions where conditions for induced seismicity exist in the study area.
Regulation of SWD Practices in Texas
Public concern over increased seismic activity led the Texas Legislature in 2015 to task the Bureau of Economic Geology at The University of Texas at Austin to lead a multi-institutional investigation to better understand the causes of earthquakes in Texas, help locate and determine the origins of these earthquakes, and propose methods to potentially reduce human-induced earthquakes in the future (State of Texas, 2016a; Rathje et al., 2018). Previous studies hypothesized that SWD and EOR injection practices from O&G operations are two factors contributing to this recent increase in earthquake activity (Davis, 1985; Davis and Pennington, 1989; Davis and Frohlich, 1993; Frohlich and Davis, 2002; Keranen et al., 2013, 2014; Weingarten et al., 2015; Frohlich et al., 2016a; Doglioni, 2017; Hincks et al., 2018; Walter et al., 2018; Hennings et al., 2019; Savvaidis et al., 2019).
Wastewater injection has been regulated for many decades. In 1974, the US Congress passed the Safe Drinking Water Act, established the Underground Injection Control (UIC) Program and granted authority to the US Environmental Protection Agency (EPA) (State of Texas, 1981; Environmental Protection Agency, 2016). The EPA separates injection wells into six different classes depending on the type of fluids being injected. For O&G operations, the UIC program categorized wastewater injection wells as class II, which includes SWD and EOR wells (State of Texas, 1981; Environmental Protection Agency, 2016). In 1982, the EPA granted primacy to the Railroad Commission of Texas (RRC) to regulate class II UIC wells in Texas. Afterward, the RRC required all O&G operators to report monthly averaged injection volumes from class II UIC wells, once per year, beginning January 1, 1983 (State of Texas, 1981). The RRC regulates three of the eight different types of class II UIC wells for injection or disposal of wastewater (Texas Water Development Board, 2014), including
Type 1: SWD wells into which wastewater is injected into a formation not productive of O&G
Type 2: SWD wells into which wastewater is injected into a formerly producing O&G formation
Type 3: EOR wells into which wastewater is injected into conventional reservoirs with the intention of producing oil through water flooding (State of Texas, 1981)
In our analysis, we categorized all class II (types 1–3) wastewater injection wells as UIC wells. The RRC separates Texas into districts depending on the geography and geology to distribute its jurisdiction across the state. The Texas panhandle falls under RRC O&G District 10. Through the application process for UIC wells, conditions are imposed by the RRC for the permitted well, including the depth intervals into which operators are allowed to inject wastewater, injection rate in barrels/day (bbl/day, where 1 bbl = 159 L), and maximum wellhead injection pressure limit in psi. The RRC can also impose a unique set of conditions for a particular operator, such as injectivity tests, tracer tests, or complete stratigraphic documentation (State of Texas, 1981). However, formation name(s) may or may not be included in the permit; therefore, a comprehensive structural/stratigraphic study is included later herein to interpret the formation(s) of injection. In the Texas panhandle, we identified a total of 1926 UIC wells that were active from 1983–2018.
Saltwater coproduced with O&G is commonly termed “produced water.” Subsurface injection of wastewater is the primary means of water management. Alternatively, the EOR or “secondary recovery” process also injects fluids into the subsurface, known as waterflooding for pressure maintenance of the reservoir, with or without the addition of chemical polymers to enhance oil production in depleted conventional reservoirs (Lake et al., 1992; Higley and Gaswirth, 2014; Clemente, 2015; Frohlich et al., 2016a; Rathje et al., 2018; Walter et al., 2018; Hennings et al., 2019; Lemons et al., 2019). Technological advances in hydraulic fracturing and horizontal drilling techniques, beginning around 2008, have significantly increased the production of O&G and produced water from unconventional reservoirs, thus increasing the volumes needed for disposal (Tilford and Stewart, 2011; Rubinstein and Mahani, 2015; Doglioni, 2017; Shapiro, 2018; Fasola et al., 2019; Lemons et al., 2019; Scanlon et al., 2019).
Study Objective
The objective of this study is to answer the following questions: What is the distribution of wastewater injection through UIC wells in the Texas panhandle between 1983 and 2018? And is there a relationship between these injection practices or other O&G activities and earthquakes with M ≥ 2.5 during this time period? In this work, we will account for geologic units and structural subregions, into which wastewater injection occurs for SWD and EOR. We will address the permitted injection intervals and well depths relative to the igneous basement and briefly address O&G operations alongside UIC practices in the area. We hypothesize that a relative link exists between current UIC and O&G operations in the study area and the increasing number of earthquakes.
This research will help address the proposed hypotheses through a series of established and novel research methods. First, a generalized geological study will help interpret the stratigraphic units in the panhandle area. Once identified, the study will highlight the geologic formations that have been targeted for UIC operations and compare injection rates to earthquakes. This research will also identify the UIC wells in close proximity to the Precambrian basement and potential prospect areas for induced seismicity. Additionally, a categorization of previous earthquakes will help identify earthquakes considered to have occurred naturally or that were induced by O&G activities, such as production or injection. The research uses the most recent production and injection data, proximity to basement, and fault locations to identify regions where an induced earthquake event could occur in the future.
METHODS
To address the proposed question and test our hypotheses, this study was subdivided into three main components:
Generalized geologic setting of the study region
The UIC well and volumetric analysis
Characterization of earthquakes with M ≥ 2.5 that occurred between 1983 and 2018
The flowchart (Figure 1) displays how the three main components of this research were addressed, their relationship to one another, and the overall workflow.
Geologic Interpretation of Study Region
The Texas panhandle has eight distinct geologic subregions, differentiated into three Precambrian uplift structures that separate five deep sedimentary structures. The uplift structures are the Amarillo-Wichita uplift, the Cimarron arch–Keyes dome, and the Bravo dome. The deep sedimentary basins are the Anadarko Basin, the Dalhart Basin, the Hollis–Hardeman Basin, the Palo Duro Basin, and the Whittenburg trough (Figure 2A, B). The uplift structures of the igneous basement are characterized by tectonic movement during the Late Pennsylvanian that span across the study area in a northwest-southeast trend, separating the major sedimentary basins (Nicholson, 1960; Dutton et al., 1982; Lindberg et al., 1983; Tilford and Stewart, 2011; Higley and Gaswirth, 2014). These basins overlie the crystalline basement uncomformably and record deposition beginning in the late Cambrian–Early Ordovician with higher sediment deposition rates occurring in the Late Pennsylvanian–early Permian (Dutton et al., 1982; Lindberg et al., 1983; Hartig et al., 2011; Kroll et al., 2017).
We compiled a generalized stratigraphic correlation chart for the Texas panhandle (Figure 3) and subdivided it by their respective structural subregions. Formation names were selected using nomenclature from operators, regulators, and literature (Nicholson, 1960; Dutton et al., 1982; Lindberg et al., 1983; Ruppel, 1985; Ruppel and Garret,1989; Hartig et al., 2011; Tilford and Stewart, 2011; Higley and Gaswirth, 2014; Kroll et al., 2017). Structural-stratigraphic grids of geologic formations present in the study region were generated to identify the formations targeted for fluid injection. These grids were generated using a ranked combination of formation tops picked by Bureau of Economic Geology researchers or subject matter experts (e.g., Ambrose et al., 2011), commercial vendors using calibrated well logs, and individual operators who submitted information to the RRC, in this order:
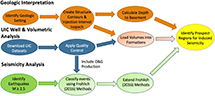 Figure 1. Flowchart illustrating the methodology used throughout the study. M = magnitude; O&G = oil and gas; UIC = underground injection control.
Researcher or subject matter expert
Commercial vendor using calibrated well logs
Operators who submitted information to the RRC
UIC Well and Volumetric Analysis
We followed the methods reported by Lemons et al. (2019) for data collection and interpretation. The data sets for UIC wells were available through regulatory sites, such as the RRC, as well as through commercial data providers (IHS Markit and B3 Insight). The data were downloaded by filtering through various RRC databases such as the “H10 Annual Disposal/Injection Well Monitoring Disposal Query” and the “Injection/Disposal Permit Query” and by searching for wells located in RRC District 10. Commercial data sets were downloaded using the IHS Markit “production allocated” query and filtered for only injection data, whereas data from B3 Insight were collected by highlighting the RRC District 10 on their platform map and downloading all available data for UIC wells. This search result was filtered further to provide only data used in the study. Data sets downloaded represent production workbooks that provide the most reliable information regarding injection wells, reported on a per-well basis. From the production workbook data set, we extracted data for individual UIC wells, including location, lease number, API identification number, volumes injected on monthly and yearly bases, and cumulative injection volumes. A secondary data set was also required for the architecture and completions summary of all wells and included usage (SWD or EOR operations) and permitted depths of injection. We then combined both data sets into a single relational data set that contained necessary information regarding UIC wells (both EOR and SWD wells) in the study area. Table 1 shows the distribution of injection wells with respect to each structural subregion.

After the wells of interest were identified, data sets were imported into an integrated geologic software (IHS Petra) used for most of the analyses in this project. The Petra-specific files contained data regarding wellbore architecture and production data, if applicable, and were matched to injection volumes from RRC. A second set of data imports contained wellhead pressure to fully analyze injection operations in the study area. From the B3 Insight data set, we gathered flowing wellhead injection pressures for each well, allowing us to see key trends in injection rates and to document pressure and/or injection changes throughout the well’s history, allowing us to apply a visual quality control of injected volumes. Specifically, if an increase or decrease in wellhead pressure was observed, we expected to see an increase or decrease in injected volume.
In addition to visual quality control, compiled data were quality controlled using statistical measures. Outliers were identified for wells when injection rates fell above or below three standard deviations of the mean value during the lifetime of each well. These outliers were replaced with the mean value of wastewater volume injected into each respective well. This step avoided overestimating or underestimating the true volume injected and accounted for possible errors made by operators when submitting data to the RRC (e.g., illegible handwriting) or when the commercial vendors transfer data onto their system (e.g., input of 1,000,000 bbl of water injection in one month when injection volume for the well previously averaged 100,000 bbl per month). By enacting this statistical quality control, we were able to isolate and remove spurious spikes (highs and lows) from the monthly injection data sets and improve the quality of the volumetric data used throughout this study. Additionally, an isopach of injection intervals was then determined from permitted tops and bottoms for each permitted UIC well. We assumed that all injection wells were screened throughout the entirety of the permitted injection interval.
Depth-to-Basement Calculation and Assigning Injectate Volumes to Geologic Formations
We calculated the distance from the bottom of the permitted injection interval to the top of the igneous Precambrian basement, also known as depth-to-basement calculation, which was considered to be a key contributor to inducing seismicity (Hincks et al., 2018; Scanlon et al., 2019). Depth-to-basement was calculated by importing all relevant UIC wells into a geographic information system (ArcGIS v.10.3.1) and layering the data onto the Tectonic Map of Texas (Ewing, 1990). Data available from Ewing (1990) included shapefiles of all basement-rooted faults, as well as contour intervals of the Precambrian basement throughout Texas. From these contour intervals, a structural grid was generated using the grid-flexing tools in ArcGIS. We then overlaid all wells in their respective locations above the Precambrian basement and calculated the distance from the bottom of the injection interval to the top of the Precambrian basement. We assigned injectate volumes into each geologic formation by checking well perforation intervals with permitted injection intervals for each well in the RRC database. Each formation that received wastewater injectate from UIC wells was color-coded following a heat scale (Lemons et al., 2019) that represents the cumulative volume ranging from blue (lowest volume) to red (highest volume). Cumulative localized injection volumes were aggregated into 10 × 10 mi block grids (259 km2 [100 mi2] area). Disposal wells were spatially assigned to the block grids using geographic mapping software.
Earthquake Analysis
We focused on earthquakes that occurred from 1983 through 2018 with local M ≥ 2.5. Earthquake data were obtained from open-source databases, such as the US Geological Survey map (
Earthquake Classification
A total of 64 earthquakes M ≥ 2.5 were recorded in the Texas panhandle from 1983 to 2018. From these earthquakes, 29 earthquakes were recorded before 2007 (1.21 earthquakes per year) and 35 earthquakes were recorded after 2007 (3.50 earthquakes per year). During the time of densest seismometer coverage (2009–2011) only six earthquakes M ≥ 2.5 were reported, indicating that increasing number of seismometer coverage did not correlate to the increasing number of earthquakes measured. Many of the earthquakes in Texas, including those with hypocenters located in O&G District 10, were naturally occurring earthquakes. However, Walter et al. (2018) reported that the recent (2008–2016) increase in earthquakes in the area was caused by a combination of O&G production, wastewater injection from UIC wells, and their respective proximity to known faults. For all 64 earthquakes, we identified all UIC and production wells within 5 km of the epicenter, as well as the shortest distance from the epicenter to a known fault.
We followed the methodology of Frohlich et al. (2016a) and Walter et al. (2018) to determine possible origins for the 64 earthquakes in the Texas panhandle, and classified earthquakes into four categories by applying a subjective-based test that allows us to interpret whether an earthquake may have been induced by O&G operations. The naming convention for these earthquakes was taken from Frohlich et al. (2016b): no evidence, minimal evidence, stronger evidence, or strongest evidence. The Frohlich et al. (2016a, b) and Walter et al. (2018) test is based on five questions and includes a scoring system that ranges between 0.0 and 5.0. Each question has three possible answers: “no or no information” is scored with a 0.0; “yes, perhaps, possible doubt” is scored with 0.5; and “yes, certainly” is scored with 1.0. The five questions are the following:
Do earthquakes in this location begin occurring only after the commencement of petroleum production or fluid injection operations?
Are epicenters spatially correlated with production or injection operations?
Is information concerning hypocentral depth available, and does this information suggest the earthquake occurred at or near production or injection depths?
Is the earthquake near a mapped fault, or is it one of a linear group of epicenters delineating a fault?
Is there a credible published paper linking the earthquake to production or injection operations?
The scoring criteria for each question was taken directly from Walter et al. (2018):
During the year of the earthquake event, if the cumulative sum of injection or production of fluids exceeded 100,000 bbl or 100,000 thousand cubic feet (MCF) of gas, the score was 1.0. Otherwise, the score was 0.0.
Determine the sum of the annual volumes from 3 yr prior to the earthquake event. If oil or gas production exceeded 300,000 bbl or MCF, assign a score of 0.5. Add another 0.5 to the score if UIC injection exceeded 300,000 bbl. If injection or production into or from any one particular well exceeded 1,000,000 bbl or MCF, assign a score of 1.0. Otherwise, the score is 0.0.
Is information available concerning focal depths of earthquakes at this location, and does this suggest some depths are shallow, probably occurring at or near production or injection depths? If so, assign a score of 1.0. Otherwise, the score is 0.0.
If the earthquake occurred at a distance of 5 km or less to a known fault, assign a score of 0.5. For this criterion, the main source of fault data is the Tectonic Map of Texas (Ewing 1990), which is the best publicly available source of faults in the Texas panhandle, although it is outdated and does not include fault geometries.
Assign a score of 0.5 to those earthquakes with 1.0 for questions 1 or 2. Otherwise assign a score of 0.0 because of the lack of published information available regarding induced seismicity in the Texas panhandle.
Table 2 lists the possible ranges of scores.

Prospect Regions for Induced Seismicity
The algorithm proposed by Frohlich et al. (2016a, b) is only used to classify earthquakes after the earthquakes have occurred. We therefore take this method one step further and try to identify those regions that could be more sensitive to induced seismicity, and possible causes if an event were to occur. This will allow future researchers to better identify geographical regions where an earthquake is more likely to be induced, and possibly inform regulators of this likelihood.
For this proposed technique, we summed production volumes and injection volumes into single respective values, converting gas production from MCF into BOE where 6 MCF equals 1 BOE (volumes for produced oil, produced water, and wastewater injectate are already expressed in barrels). We chose 2016–2018 as our time period because 2018 was the most up-to-date data available. We then subsetted injection and production volumes into a 2018-only data set. The two data sets of injection and production (2016–2018) and (2018 only) follow the overall approach and criteria reported by Frohlich et al. (2016 a, b), except they used injection and production data sets for 3 yr prior to the earthquake occurring and the year that the earthquake occurred. Data sets were imported into ArcGIS (v.10.3.1) where four kernel density plots of the produced and injected volumes were generated at a radius of 9.08 km (5.64 mi), which matches the regulatory requirements set by the RRC (State of Texas, 2016b). This allows us to visualize injection and production hotspots within a 259 km2 (100 mi2) area (Silverman, 1986; Hincks et al., 2018).
We also applied a 5-km buffer around every known fault trace and identified operating injection and production wells within it. This buffer size follows Frohlich et al. (2016a). Finally, we included depth-to-basement for all injection wells active during these time periods. This proposed approach classifies the area of interest according to its sensitivity to a potential earthquake event induced by O&G and/or UIC operations. For this method, the calculation criteria were as follows:
Normalize all cumulative injection volumes for the year 2018 on a scale from 1 to 10. If cumulative sum of injection is equal to or exceeds 500,000 bbl, assign the highest score of 10.
Normalize all cumulative production volumes for the year 2018 on a scale from 1 to 10. If cumulative sum of production is equal to or exceeds 500,000 BOE, assign the highest score of 10.
Normalize all cumulative injection volumes for the years 2016–2018 on a scale from 1 to 10. If cumulative sum of injection is equal to or exceeds 1,000,000 bbl, assign the highest score of 10.
Normalize all cumulative production volumes for the years 2016–2018 on a scale from 1 to 10. If cumulative sum of production is equal to or exceeds 1,500,000 BOE, assign the highest score of 10.
Apply a 5-km buffer around all known faults in the Texas panhandle and assign the buffer a value of 5 if the fault geometry is undetermined.
Normalize depth-to-basement values for all injection wells for the year 2018 on a scale from 1 to 5. If wells are injecting wastewater at or into the basement, assign the highest score of 5.
Normalize depth-to-basement values for all injection wells for the years 2016–2018 on a scale from 1 to 5. If wells are injecting wastewater at or into the basement, assign the highest score of 5.
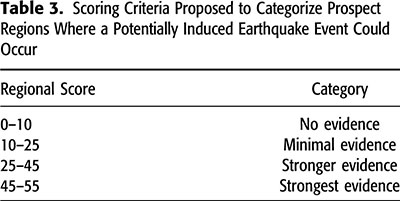
We summed up the regional scores for these criteria and recovered an output of values from 0 to 55, at which point we applied the classification algorithm (Table 3).
RESULTS
UIC Wells and Injected Wastewater Analysis
The injection interval isopach (Figure 4) shows that, although many of the UIC wells are not injecting into the same geologic units, they have similar permitted intervals for wastewater injection. The range of injection intervals, permitted by the RRC, is between 0 and 150 m (0∼500 ft) for 88% of all wells; between 150 and 600 m (∼500∼2000 ft) for 10% of the wells, and exceeds 600 m (∼2000 ft) for the remaining 2% of the UIC wells. Wells with the thinnest injection interval (between 0 and 150 m) are all geographically located inside the boundaries of the uplift structures in the panhandle: the Amarillo-Wichita uplift and the Cimarron arch–Keyes dome. Only 2% of wells are injecting into units with intervals greater than 600 m, and all are located in the deep sedimentary basins, Anadarko Basin and Dalhart Basin. These wells are potentially injecting fluids into several geologic units; thus, pressure increase caused by injection into each geologic formation may not be elevated. However, the larger injection interval can also reveal unknown or unmapped faults in these geologic structures if an earthquake occurs in an area where the fault maps are not complete. If, for example, faults exist in formations with higher permeability, and act as no-flow hydrological boundaries, then wastewater reaching this no-flow boundary could increase fluid pressure along the fault plane, potentially reactivating the fault and inducing an earthquake (Kim and Hosseini, 2017; Hincks et al., 2018). In contrast with deep sedimentary basins elsewhere, a lower number of geologic units are present in the Precambrian uplifts of the Texas panhandle, and with less distance from surface to the top of the basement available for disposal. The smaller injection interval above the Precambrian uplifts could translate to a higher pressure increase in formations receiving wastewater, depending on the injection pressure, and propagate to the igneous basement.
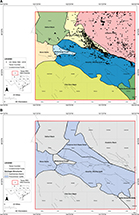 Figure 2. Top map (A) shows seven structural subregions. Dashed lines depict basement-rooted faults with undetermined geometry taken from Ewing (1990). Black dots represent 1926 underground injection control (UIC) wells. Respective well count for each structural subregion seen in Table 1. Bottom map (B) shows the different structural subregions of the Texas panhandle. Blue regions denote Precambrian uplift structures and gray regions denote deep sedimentary basins. O&G = oil and gas; RRC = Railroad Commission of Texas.
Currently, 95% of the wells injecting wastewater into the igneous basement are completed in the Amarillo-Wichita uplift, whereas the remaining 5% of the wells are completed in the Cimarron arch-Keyes dome, also part of the Precambrian uplift structure (Figure 5). Wastewater is being injected into the Precambrian uplift structures at intervals 0–150 m. The combination of a small interval range and injection into the Precambrian basement are conditions found elsewhere to correlate to induced earthquakes (Hincks et al., 2018). Additionally, we found that 98% of wells that inject wastewater 2000 m (∼6500 ft) above the basement are located in deep sedimentary basins; these wells have larger intervals for injection permitted by the RRC. We observe two key trends:
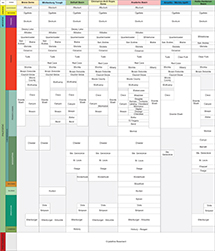 Figure 3. Generalized stratigraphic correlation chart of the geological formations in the Texas panhandle within each structural region. Distinction from Precambrian uplift structures and deep sedimentary basins corresponds to colors in Figure 2A.
UIC wells with smaller injection intervals and well completion depths near to or at the basement are found in the Precambrian uplift structures such as the Amarillo-Wichita uplift and Cimarron arch–Keyes dome.
UIC wells with larger injection intervals and well completion depths farther from the basement are found in the deep sedimentary basins such as the Anadarko and Dalhart Basins.
From 1983 to 2018, a total of 2.26 × 10⁹ bbl (billion barrels) of fluid were injected into the 1926 UIC wells used in this study. Seven particular formations targeted for UIC wastewater injection, colored in red (Figure 6), all received more than 100 × 106 bbl (million barrels) of cumulative wastewater injectate during our study period. The seven formations with the highest volume of injection through UIC wells are the Brown Dolomite, Council Grove, Moore County, Wolfcamp, Morrow, Granite Wash, and crystalline basement, and all are found in only three geological subregions: the Amarillo-Wichita uplift, the Cimarron arch–Keyes dome, and the Anadarko Basin (Figure 6). We calculated more than 1.97 billion bbl (87% of total) injected into these seven geologic units. The remaining formations each received less than 10 million bbl of wastewater. Results highlight that UIC practices in the study area are highly localized into certain geologic formations and subregions.
 Figure 4. Map of injection interval isopach permitted by the Railroad Commission of Texas, plus injection wells (black dots) active between 1983 and 2018. Gray isopach corresponds to 0–150 m (0∼450 ft) permitted intervals with colors increasing every 150 m (450 ft) onward. Dashed lines depict basement-rooted faults with undetermined geometry taken from Ewing (1990).
Total cumulative volume was calculated for each 10 × 10 mi grid block and then color-coded according to quantity (Figure 7). Earthquakes with M ≥ 2.5 were included in this figure to show how volumetric disposal rates and earthquakes varied through time and space, as others have shown (Ellsworth, 2013; Hincks et al., 2018; Rathje et al., 2018; Shapiro, 2018; Walter et al., 2018; Lemons et al., 2019; Scanlon et al., 2019; Teng and Baker, 2019). A total of 45% of the recorded earthquakes occurred in grid blocks with wastewater injection. Of these earthquakes, the smallest recorded earthquake (M = 2.5) occurred in 1990, and the largest recorded earthquake event (M = 4.3) occurred in 2014. Cumulative volumes of 8 million bbl and 17 million bbl were injected into the grid blocks that contain the smallest and largest magnitude earthquakes, respectively. Furthermore, 67% of the blocks received less than 10 million bbl of wastewater injectate. In many cases, wastewater was injected into wells completed in different formations within each grid block. Also, because some geological units extend laterally across the entire study region, one geologic unit can be targeted through multiple wells in separate grid blocks. This trend is visible in grid blocks where total cumulative injection exceeds 100 million bbl. Given the variability of injection depths, a high volume of wastewater injected per well in the red grid blocks therefore identifies those geographical areas targeted by UIC operators.
 Figure 5. Basement elevation in study area generated from Ewing (1990). Colored dots indicate wastewater injection into the Precambrian basement. Dashed lines depict basement-rooted faults with undetermined geometry taken from Ewing (1990). mbsl = meters below sea level; O&G = oil and gas; pϵ = Precambrian; RRC = Railroad Commission of Texas; UIC = underground injection control.
Annual wastewater injection (Figure 8) shows the up-and-down production cycles of the O&G industry. Visible data gaps in the injection data set are observed throughout the 1980s, when data were not available in the RRC database. Beginning in the 1990s and thereafter, a continuous set of reported UIC volumes has been available for the area. Results show that 52% of all produced wastewater was injected into the Anadarko Basin, and the lowest volume (0.2%) into the Hollis–Hardeman Basin. As seen in Figure 8, as injection rates increased around 2008, an increase in earthquakes began to occur. A relative relationship can be drawn with the peaks of injection seen with the number of recorded earthquakes (Figure 8). The maximum number of earthquakes occurred in December 2000, where six earthquakes were recorded in Potter County, which lies within the Amarillo-Wichita uplift. During that year, neither total permits nor volumes produced by O&G operators in that county increased significantly (Texas Drilling, 2018). However, these O&G operations were actively producing hydrocarbons in close proximity to faults, and the six earthquakes that occurred in this region were considered to show stronger evidence of being induced because of the O&G production, not wastewater injection practices. Following this increase in seismicity rates, wastewater injection peaked in the same county and into the Amarillo-Wichita uplift geologic subregion. From these results, we demonstrate that induced earthquakes can occur from a combination of different O&G production practices, not just injection practices.
 Figure 6. Heat-mapped stratigraphic correlation chart with disposal targets within each structural subregion. Subregion color in the top row corresponds to map color in Figure 2A. Formation colors indicate injection volume in million barrels (MMbbls) between 1983 and 2018; white indicates no injection into formation. UIC = underground injection control.
In January 2012, earthquake activity was located in the Amarillo-Wichita uplift and Bravo dome, where significant UIC operations were occurring. Elevated earthquake activity in April 2013 was located in the Anadarko Basin (two of three earthquakes) and Bravo dome (one of three earthquakes); most SWD occurred in the Anadarko Basin. From this analysis, we cannot directly connect peak UIC operations with elevated seismic activity occurring in the Anadarko Basin or Bravo dome subregions, but we cannot rule it out either, meaning that UIC practices may not be solely responsible for these earthquake occurrences, but could have been a contributing factor alongside O&G practices.
Earthquake Classification and Prospect Regions for Induced Seismicity
For the earthquakes following the Frohlich et al. (2016b) and Walter et al. (2018) classification scheme, Figure 9 shows where the 64 earthquakes M ≥ 2.5 were located across the study area, as well as the location of the seismometers. Of these earthquakes, 26 earthquakes (39%) are considered to have no evidence for induced seismicity. For the other earthquakes, we identified 19 earthquakes with minimal evidence (30%), and 20 earthquakes with stronger evidence (31%) of being induced, meaning that a link is possible or probable between O&G operations, including wastewater injection, and the increased observed seismicity rates. No earthquakes in the panhandle received a score higher than 3.5, which is categorized as showing strongest evidence for being induced by O&G operations. This categorization scheme implies the potential mix of UIC, O&G operations, and other geological processes could be contributing to the increased rates of earthquakes.
 Figure 7. Geographic distribution of cumulative wastewater injection volumes in 259 km2 (100 mi2) block grids, following the same color scale as Figure 6, between 1983 and 2018. Green circles represent earthquakes (EQ) with magnitude ≥ 2.5 that occurred during this time period; symbol size is relative to magnitude. Dashed lines depict basement-rooted faults with undetermined geometry taken from Ewing (1990). MMbbls = million barrels; O&G = oil and gas; RRC = Railroad Commission of Texas.
The prospect regions for induced seismicity map (Figure 10) highlights the areas with their respective scores relative to the potential for future earthquakes. This map demonstrates that, if an earthquake were to occur in the highlighted regions, it would be classified as either minimal evidence (24% of area) for induced seismicity (yellow regions), stronger evidence (8% of area) for induced seismicity (red regions), or strongest evidence (1% of area) for induced seismicity (maroon regions). The remaining areas of the map (67%) with no color would be regions where earthquakes are mostly likely to be tectonic in nature. The colored areas in Figure 10 also show regions with a high concentration of either production or injection operations. For example, maroon- and red-colored regions correspond to where a high concentration of injection and/or production is occurring, regardless of whether these regions are near faults. Areas with these high-volume operations produced more than 1.5 million BOE and injected more than 1.5 million bbl during the years 2016–2018. Moreover, proximity to known faults, wastewater injection into UIC wells at or near the Precambrian basement, and elevated injection and production volumes are within the maroon-colored area.
 Figure 8. Injection volume subdivided by structural subregions from 1983–2018. Subregion color corresponds to map color in Figure 2A. Volumes into Bravo dome and Hollis–Hardeman Basin are too low to appear in the graph. The black stacked bars represent the earthquake count (secondary axis) for each month for earthquakes with magnitude (M) ≥ 2.5. Maximum seismometer coverage (19 stations total) occurred from 2009–2011 where a total of six earthquakes M ≥ 2.5 (out of the 64 total) occurred in the study area. ANSS = Advanced National Seismic System; IRIS = Incorporated Research Institutions for Seismology; MMbbls = million barrels; USGS = US Geological Survey.
 Figure 9. Map of earthquakes (colored circles) and their respective classification following the methods of Frohlich et al. (2016a, b). Black dots represent all underground injection control (UIC) wells present in study area and dashed lines depict basement-rooted faults with undetermined geometry taken from Ewing (1990). Active seismometer stations including their active years depicted as colored triangles. ANSS = Advanced National Seismic System; IRIS = Incorporated Research Institutions for Seismology; O&G = oil and gas; RRC = Railroad Commission of Texas; TA = USArray transportable array; USGS = US Geological Survey.
DISCUSSION
From the results obtained through this project, we showed that 2.26 billion bbl of wastewater were injected into deep geologic formations from seven distinct structural subregions. Injection was highly localized both geographically and geologically in the Texas panhandle. We showed that 95% (2.15 billion bbl) of total wastewater injection was concentrated into three of the seven subregions: the Anadarko Basin (52%; 1.18 billion bbl), Cimarron arch–Keyes dome (27%; 0.61 billion bbl or 610 million bbl), and the Amarillo-Wichita uplift (17%; 0.38 billion bbl or 380 million bbl). Within these three subregions, UIC operators injected 87% of total volume (1.96 billion bbl) into seven specific geologic formations: the Brown Dolomite (31%; 697 million bbl); Wolfcamp (14%; 319 million bbl); Granite Wash (14%; 312 million bbl); Moore County (9%; 210 million bbl); Council Grove (8%; 193 million bbl); Morrow (6%; 129 million bbl); and crystalline basement (5%; 103 million bbl). All other injection volumes can be found in Figure 12 in the Appendix. Additionally, UIC operators focused most of their injection practices on the Anadarko Basin. This deep sedimentary basin is a high producer of O&G, therefore making it a major target for UIC operations. We reported that 52% (1.18 billion bbl) of the total volume disposed was injected into the Anadarko Basin, despite having only 33% of the UIC wells in the study area. The combination of high wastewater injection volumes and high production volumes points to the northern Anadarko Basin as a potential prospect region for future induced earthquakes. Additionally, in the southeast part of the Anadarko Basin (Wheeler County), we identified three prospect regions where all or most of the high-risk factors were present. The same criterion was observed in the northeast part of the Amarillo-Wichita uplift (Gray County), a region classified as showing “strongest evidence” of a potential earthquake event.
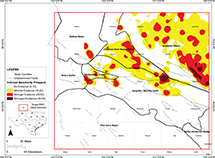 Figure 10. Map showing prospect regions following the proposed modification of the Frohlich et al. (2016a, b) methods. Dashed lines depict basement-rooted faults with undetermined geometry taken from Ewing (1990). O&G = oil and gas; RRC = Railroad Commission of Texas.
The RRC issues different permits for operators, allowing them to inject wastewater into specific depths. The injection intervals allowed by the RRC can range from 0 m to exceeding 600 m (0∼2000 ft). Permitted depths for injection may be close to or extend into the igneous basement. These O&G and UIC operations could potentially explain the increase in earthquake rates observed in District 10. Following the classification scheme, we noted that 61% of recorded earthquakes during the monitoring period displayed minimal or stronger evidence of being induced by O&G and UIC operations, versus 39% of earthquakes that likely occurred tectonically or with no evidence of being induced. Most of the tectonically derived earthquakes occurred near the western border of District 10, or in the Palo Duro Basin in the southern part of the panhandle. This region has been of low interest from O&G operators because of its lack of economically viable resources. On the contrary, the earthquakes considered to have minimal or stronger evidence are either in the basement uplift regions, such as the Amarillo-Wichita uplift, or near high-volume O&G production or UIC activities, such as the Whittenburg trough or the Anadarko Basin.
We conclude that a relative link exists between O&G and UIC operations and induced seismicity in the Texas panhandle. However, we note that induced seismicity is a complex mechanism and multiple factors can contribute to it. Regions where an induced event are most likely to occur are those with a combination of high production and injection volumes as well as proximity to known faults. Additionally, the depth-to-basement of injection wells was identified as correlated to induced seismic activity.
Since the end of our study period and between 2019 and 2020, a total of 12 earthquakes have occurred in the study area. The epicenter of 5 of the 12 earthquakes was located in zones identified as having minimal-stronger evidence for induced seismicity. However, the magnitude of all five induced earthquakes was M
These data can be used to assist researchers and regulators understand and address induced seismicity in the Texas panhandle. From this, the RRC can determine whether to reduce permitted injection volumes and redefine injection depths, as was done by Oklahoma regulators (Langenbruch and Zoback, 2016; Niyibizi et al., 2019). If injection can be more evenly distributed across geographical regions and geologic formations, then induced seismicity could potentially be managed.
REFERENCES CITED
Ambrose, W. A., T. F. Hentz, D. L. Carr, and J. Sprowl, 2011, “Oil- and gas-production plays and trends in the Pennsylvanian Marmaton Group and Cleveland Formation, Anadarko Basin, North Texas and Western Oklahoma” in Sequence stratigraphy, depositional systems, and hydrocarbon play analysis of the Pennsylvanian Cleveland Formation and Marmaton Group, Anadarko Basin, North Texas and Western Oklahoma: Austin, Texas, The University of Texas at Austin, Bureau of Economic Geology Report of Investigations 275, p. 67–98.
Clemente, J., 2015, The importance of Texas’ oil and natural gas surge, accessed April 24, 2020, https://www.forbes.com/sites/judeclemente/2015/05/17/the-importance-of-texas-oil-and-natural-gas-surge/#263b0355c9b6.
Davis, S. D., 1985, Investigations of natural and induced seismicity in the Texas Panhandle, Master’s thesis, The University of Texas at Austin, Austin, Texas, 230 p.
Davis, S. D., and C. Frohlich, 1993, Did (or will) fluid Injection cause earthquakes? - Criteria for a rational assessment: Seismological Research Letters, v. 64, p. 207–224, doi:10.1785/gssrl.64.3-4.207.
Davis, S. D., and W. D. Pennington, 1989, Induced seismic deformation in the Cogdell oil field of west Texas: Bulletin of the Seismological Society of America, v. 79, p. 1477–1495, doi:10.1785/BSSA0790051477.
DeShon, H. R., C. T. Hayward, P. O. Ogwari, L. Quinones, O. Sufri, B. Stump, and M. B. Magnani, 2019, Summary of the North Texas Earthquake Study Seismic Networks, 2013–2018: Seismological Research Letters, v. 90, no. 1, p. 387–394, doi:10.1785/0220180269.
Doglioni, C., 2017, A classification of induced seismicity: Geoscience Frontiers, v. 9, p. 1903–1909, doi:10.1016/j.gsf.2017.11.015.
Dutton, S. P., A. G. Goldstein, and S. C. Ruppel, 1982, Petroleum potential of the Palo Duro Basin, Texas Panhandle, Report of Investigations 123: Austin, Texas, University of Texas at Austin, Bureau of Economic Geology, p. 47, plates II and IV.
Ellsworth, W. L., 2013, Injection-induced earthquakes: Science, v. 341, no. 6142, 7 p., doi:10.1126/science.1225942.
Environmental Protection Agency, 2016, Underground injection control regulations and Safe Drinking Water Act provisions: Washington, DC, US Environmental Protection Agency, accessed February 22, 2022, https://www.epa.gov/uic/underground-injection-control-regulations-and-safe-drinking-water-act-provisions.
Everley, S., 2016, The limits of a new ‘five question test’ for analyzing Texas earthquakes: Energy in depth, accessed August 12, 2021, https://www.energyindepth.org/limits-five-question-test-texas-earthquakes.
Ewing, T., 1990, Tectonic map of Texas: Austin, Texas, University of Texas Bureau of Economic Geology State Map SM 1, scale 1:750,000, 4 oversized sheets.
Fasola, S. L., M. R. Brudzinski, R. J. Skoumal, T. Langenkamp, B. S. Currie, and K. J. Smart, 2019, Hydraulic fracture injection strategy influences the probability of earthquakes in the Eagle Ford shale play of South Texas: Geophysical Research Letters, v. 46, no. 22, p. 12958–12967, doi:10.1029/2019GL085167.
Frohlich, C., and S. D. Davis, 2002, Texas earthquakes, Austin, Texas, University of Texas Press, 293 p.
Frohlich, C., H. DeShon, B. Stump, C. Hayward, M. Hornbach, and J. I. Walter, 2016a, A historical review of induced earthquakes in Texas: Seismological Research Letters, v. 87, no. 4, p. 1022–1038, doi:10.1785/0220160016.
Frohlich, C., H. DeShon, B. Stump, C. Hayward, M. Hornbach, and J. I. Walter, 2016b, Reply to “comment on ‘a historical review of induced earthquakes in Texas’ [by Cliff Frohlich, Heather DeShon, Brian Stump, Chris Hayward, Matt Hornbach, and Jacob I. Walter]” by Steve Everley: Seismological Research Letters, v. 87, no. 6, p. 1381–1383, doi:10.1785/0220160148.
Hartig, K. A., G. S. Soreghan, R. H. Goldstein, and M. H. Engel, 2011, Dolomite in Permian paleosols of the Bravo Dome CO2 Field, U.S.A.: Permian reflux followed by the late recrystallization at elevated temperature: Journal of Sedimentary Research, v. 81, no. 4, p. 248–265, doi:10.2110/jsr.2011.24.
Hennings, P. H., J.-E. L. Snee, J. L. Osmond, H. R. DeShon, R. Dommisse, E. Horne, C. Lemons, and M. D. Zoback, 2019, Injection-induced seismicity and fault-slip potential in the Fort Worth Basin, Texas: Bulletin of the Seismological Society of America, v. 109, no. 5, p. 1615–1634, doi:10.1785/0120190017.
Higley, D. K., and S. B. Gaswirth, 2014, Overview, in D. K. Higley, ed., Petroleum systems and assessment of undiscovered oil and gas in the Anadarko Basin Province, Colorado, Kansas, Oklahoma, and Texas—USGS Province 58: Reston, Virginia, US Geological Survey Digital Data Series DDS-69-EE, US Geological Survey, 9 p.
Hincks, T., W. Aspinall, C. Cooke, and T. Gernon, 2018, Oklahoma’s induced seismicity strongly linked to wastewater injection depth: Science, v. 359, no. 6381, p. 1251–1255, doi:10.1126/science.aap7911.
Hosseini, S. M., T. H. W. Goebel, B. Jha, and F. Aminzadeh, 2018, A probabilistic approach to injection-induced seismicity assessment in the presence and absence of flow boundaries: Geophysical Research Letters, v. 45, no. 16, p. 8182–8189, doi:10.1029/2018GL077552.
Keranen, K. M., H. M. Savage, G. A. Abers, and E. S. Cochran, 2013, Potentially induced earthquakes in Oklahoma, USA: Links between wastewater injection and the 2011 Mw 5.7 earthquake sequence: Geology, v. 41, no. 6, p. 699–702, doi:10.1130/G34045.1.
Keranen, K. M., M. Weingarten, G. A. Abers, B. A. Bekins, and S. Ge, 2014, Sharp increase in central Oklahoma seismicity since 2008 induced by massive wastewater injection: Science, v. 345, no. 6195, p. 448–451, doi:10.1126/science.1255802.
Kim, J.-W., and Z. Lu, 2018, Association between localized geohazards in West Texas and human activities, recognized by Sentinel—1A/B satellite radar imagery: Scientific Reports, v. 8, 4727, 13 p., doi:10.1038/s41598-018-23143-6.
Kim, S., and S. A. Hosseini, 2017, Study on the ratio of pore-pressure/stress changes during fluid injection and its implications for CO2 geologic storage: Journal of Petroleum Science Engineering, v. 149, p. 138–150, doi:10.1016/j.petrol.2016.10.037.
Kroll, K. A., E. S. Cochran, and K. E. Murray, 2017, Poroelastic properties of the Arbuckle Group in Oklahoma derived from well fluid level response to the 3 September 2016 Mw 5.8 Pawnee and 7 November 2016 Mw 5.0 Cushing Earthquakes: Seismological Research Letters, v. 88, no. 4, p. 963–970, doi:10.1785/0220160228.
Lake, L. W., R. L. Schmidt, and P. B. Venuto, 1992, A niche for enhanced oil recovery in the 1990s: Petroleum Engineer International, v. 4, p. 55–61.
Langenbruch, C., and M. Zoback, 2016, How will induced seismicity in Oklahoma respond to decreased saltwater injection rates?: Science Advances, v. 2, no. 11, 9 p., doi:10.1126/sciadv.1601542.
Lemons, C. R., G. McDaid, K. M. Smye, J. P. Acevedo, P. H. Hennings, A. Banerji, and B. R. Scanlon, 2019, Spatiotemporal and stratigraphic trends in saltwater disposal practices of the Permian Basin, Texas and New Mexico, United States: Environmental Geoscience, v. 26, no. 4, p. 107–124, doi:10.1306/eg.06201919002.
Lindberg, F. A., O. E. Childs, G. Steele, and A. Salvador, 1983, Correlation of stratigraphic units in North America. Southwest/Southwest Mid-continent correlation chart: Flagstaff, Arizona, AAPG/Correlation of Stratigraphic Units of North America Project.
Lomax, A., and A. Savvaidis, 2019, Improving absolute earthquake location in West Texas using probabilistic, proxy ground-truth station corrections: Journal of Geophysical Research. Solid Earth, v. 124, no. 11, p. 11447–11465, doi:10.1029/2019JB017727.
Mignan, A., and J. Woessner, 2012, Estimating the magnitude of completeness for earthquake catalogs: Zurich, Switzerland, Swiss Seismological Survey, ETH Zurich University, Community Online Resources for Statistical Seismicity Analysis, 45 p., doi:10.5078/corssa-00180805.
Nicholson, J. H., 1960, Geology of the Texas Panhandle, in F. B. Conselman, J. D. Martinez, E. H. Statham, L. G. Howell, H. F. Nelson, J. H. Nicholson, J. L. Wilson, and O. P. Majewske, and A. Young, eds., Aspects of the geology of Texas: A symposium: Austin, Texas, University of Texas at Austin Bureau of Economic Geology, p. 51–64.
Niyibizi, B., J. N. Ng’ombe, and T. A. Boyer, 2019, Regulating earthquake risk: Preferences for trade-offs between economic benefits and regulation of produced wastewater injection from hydraulic fracturing: Journal of Environmental Planning and Management, v. 63, no. 6, p. 981–1000, doi:10.1080/09640568.2019.1625757.
Pollyea, R. M., M. C. Chapman, R. S. Jayne, and H. Wu, 2019, High density oilfield wastewater disposal causes deeper, stronger, and more persistent earthquakes: Nature Communications, v. 10, no. 1, 10 p., doi:10.1038/s41467-019-11029-8.
Quinones, L., H. R. DeShon, S. Jeong, P. Ogwari, O. Sufri, M. M. Holt, and K. B. Kwong, 2019, Tracking induced seismicity in the Fort Worth Basin: A summary of the 2008–2018 North Texas Earthquake Study Catalog: Bulletin of the Seismological Society of America, v. 109, no. 4, p. 1203–1216, doi:10.1785/0120190057.
Rathje, E., P. Hennings, A. Savvaidis, and M. Young, 2018, 2018 biennial report on seismic monitoring and research in Texas: Austin, Texas, Bureau of Economic Geology, 32 p.
Rubinstein, J. L., and A. B. Mahani, 2015, Myths and facts on wastewater injection, hydraulic fracturing, enhanced oil recovery, and induced seismicity: Seismological Research Letters, v. 86, no. 4, p. 1060–1067, doi:10.1785/0220150067.
Ruppel, S. C., 1985, Stratigraphy and petroleum potential of pre-Pennsylvanian Rocks, Palo Duro Basin, Texas Panhandle: Austin, Texas, University of Texas at Austin, Bureau of Economic Geology Report of Investigations 147, 81 p.
Ruppel, S. C., and C. M. Garret, 1989, Texas Panhandle (RRC District 10), in E. C. Kosters, D. G. Bebout, S. J. Seni, C. M. Garrett, L. F. Brown, H. S. Hamlin, S. P. Dutton, , eds., Atlas of major Texas gas reservoirs: Austin, Texas, The University of Texas at Austin Bureau of Economic Geology, p. 133–153.
Savvaidis, A., B. Young, G.-c D. Huang, and A. Lomax, 2019, TexNet: A statewide seismological network in Texas: Seismological Research Letters, v. 90, p. 1702–1715, doi:10.1785/0220180350.
Scanlon, B. R., M. B. Weingarten, K. E. Murray, and R. C. Reedy, 2019, Managing basin‐scale fluid budgets to reduce injection‐induced seismicity from the recent U.S. shale oil revolution: Seismological Research Letters, v. 90, no. 1, p. 171–182, doi:10.1785/0220180223.
Shapiro, S. A., 2018, Seismogenic index of underground fluid injections and productions: Journal of Geophysical Research. Solid Earth, v. 123, no. 9, p. 7983–7997, doi:10.1029/2018JB015850.
Silverman, B. W., 1986, Density estimation for statistics and data analysis: London, Chapman and Hall, 176 p.
State of Texas, 1981, Texas Water Code, Chapter 27, Subchapter C, Section 27.031, Permit from Railroad Commission: Austin, Texas, State of Texas.
State of Texas, 2016a, House bill 2, Section 16: Austin, Texas, Texas Legislative Council.
State of Texas, 2016b, Texas administrative code, Title 16, Part 1, Chapter 3, Section 3.9, Disposal wells: Austin, Texas, State of Texas.
Teng, G., and J. W. Baker, 2019, Seismicity declustering and hazard analysis of the Oklahoma-Kansas region: Bulletin of the Seismological Society of America, v. 109, no. 6, p. 2356–2366, doi:10.1785/0120190111.
Texas Drilling, 2018, Oil wells and production in Sherman County, TX, accessed February 15, 2022, http://www.texas-drilling.com/sherman-county.
Texas Water Development Board, 2014, Manual for permitting process, p. 3, accessed March 23, 2020, http://www.twdb.texas.gov/publications/reports/contracted_reports/doc/1004831106_injectionwells.pdf.
Tilford, M. J., and M. R. Stewart, 2011, Barnett Shale and Atoka Conglomerate: The next horizontal oil and gas play in Oklahoma: Shale Shaker, v. 62, p. 10–31.
Walter, J. I., C. Frohlich, and T. Borgfeldt, 2018, Natural and induced seismicity in the Texas and Oklahoma panhandles: Seismological Research Letters, v. 89, no. 6, p. 2437–2446, doi:10.1785/0220180105.
Weingarten, M., S. Ge, J. W. Godt, B. A. Bekins, and J. L. Rubinstein, 2015, High-rate injection is associated with the increase in U.S. mid-continent seismicity: Science, v. 348, p. 1336–1340, doi:10.1126/science.aab1345.
AUTHORS
Juan P. Acevedo is currently a hydrologist for the Texas Water Development Board in Austin, Texas. In 2018, Juan earned a B.Sc. in geophysics from Texas A&M University and an M.Sc. in energy and earth resources from The University of Texas (UT) in 2020. While conducting this research, Juan was a graduate research assistant at the Bureau of Economic Geology.
Casee R. Lemons, director of geoscience at Sourcewater, Inc., leads her team in advanced data science and engineering systems. Casee was awarded the Top Energy Innovator award by Hart Energy in 2019, the Rising Star Award by the Houston Geological Society in 2015, and in 2012 she received research fellowships from the Smithsonian National Museum of Natural History and the US National Science Foundation–Australian Academy of Science.
Michael H. Young is a senior research scientist at the Bureau of Economic Geology, Jackson School of Geosciences, UT Austin. He has published nearly 100 peer-reviewed articles about a wide variety of environmental geoscience topics. He is a Fellow of the Geological Society of America (GSA).
Guin McDaid is an energy data and geographic information system (GIS) analyst for the Bureau of Economic Geology at UT Austin. She received both her bachelor’s degree in anthropology/geography and her master’s degree in geography at Texas State University in 2011 and 2013, respectively. Her work focuses on energy data analysis, database management, and GIS mapping.
Bridget R. Scanlon is a senior research scientist at the Bureau of Economic Geology, Jackson School of Geosciences, UT Austin. Her recent research has focused on water and energy issues in United States shale plays. She has published approximately 160 papers and is a Fellow of American Geophysical Union and GSA and a member of the National Academy of Engineering.
ACKNOWLEDGMENTS
The authors thank the Railroad Commission of Texas for their cooperation and resources for data acquisition. Well data were also downloaded from service providers IHS Markit and B3 Insight. Funding for this project was provided by the Center for Integrated Seismicity Research at UT Austin and Regional Induced Seismicity Collaborative, funded by the US Department of Energy, through Groundwater Protection Council, under agreement number DE-FE0027702. The authors additionally thank Alexandros Savvaidis from the Bureau of Economic Geology at UT Austin for his calculation of the magnitude of completeness of earthquake data sets in the Texas panhandle. Software use includes IHS Petra (v.3.8.3) for well volumes relational database and ArcMap (v.10.3.1) for GIS mapping and analysis of prospect regions for induced seismicity.
APPENDIX: SUPPLEMENTARY FIGURES
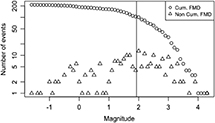 Figure 11. Magnitude of completeness calculation, using Walter et al. (2018) seismic data set, and method of Mignan and Woessner (2012). Magnitude of completeness is M1.98 ± 0.45. Cum. FMD = cumulative frequency magnitude distribution.
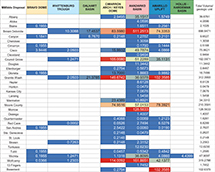 Figure 12. Heat-mapped stratigraphic disposal targets within each structural subregion. A total of 2.26 billion bbl of wastewater were injected into these formations. Rightmost column values are expressed in million barrels (MMbbls). Cumulative volumetric color scale is the same as used in Figures 6 and 7. Formations with no injection are not included here.