The AAPG/Datapages Combined Publications Database
AAPG Bulletin
Figure
AAPG Bulletin; Year: 2022; Issue: April DOI: 10.1306/EG.01072120005
Return to Full Text
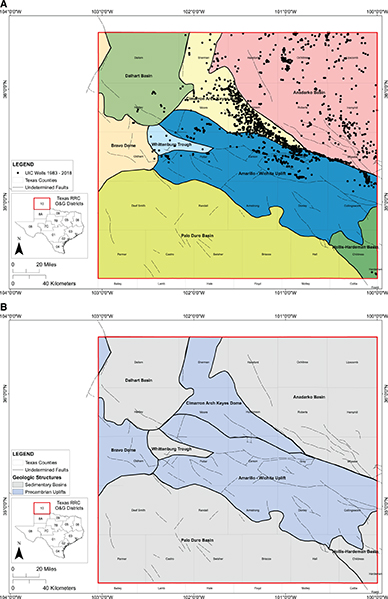
Figure 2.
Top map (A) shows seven structural subregions. Dashed lines depict basement-rooted faults with undetermined geometry taken from Ewing (1990). Black dots represent 1926 underground injection control (UIC) wells. Respective well count for each structural subregion seen in Table 1 . Bottom map (B) shows the different structural subregions of the Texas panhandle. Blue regions denote Precambrian uplift structures and gray regions denote deep sedimentary basins. O&G = oil and gas; RRC = Railroad Commission of Texas.
Figure 2.
Top map (A) shows seven structural subregions. Dashed lines depict basement-rooted faults with undetermined geometry taken from Ewing (1990). Black dots represent 1926 underground injection control (UIC) wells. Respective well count for each structural subregion seen in