The AAPG/Datapages Combined Publications Database
AAPG Bulletin
Figure
AAPG Bulletin; Year: 2022; Issue: April DOI: 10.1306/EG.01072120005
Return to Full Text
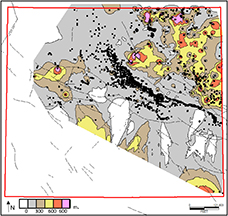
Figure 4.
Map of injection interval isopach permitted by the Railroad Commission of Texas, plus injection wells (black dots) active between 1983 and 2018. Gray isopach corresponds to 0–150 m (0∼450 ft) permitted intervals with colors increasing every 150 m (450 ft) onward. Dashed lines depict basement-rooted faults with undetermined geometry taken from Ewing (1990).
Figure 4. Map of injection interval isopach permitted by the Railroad Commission of Texas, plus injection wells (black dots) active between 1983 and 2018. Gray isopach corresponds to 0–150 m (0∼450 ft) permitted intervals with colors increasing every 150 m (450 ft) onward. Dashed lines depict basement-rooted faults with undetermined geometry taken from Ewing (1990).