The AAPG/Datapages Combined Publications Database
AAPG Bulletin
Figure
AAPG Bulletin; Year: 2022; Issue: April DOI: 10.1306/EG.01072120005
Return to Full Text
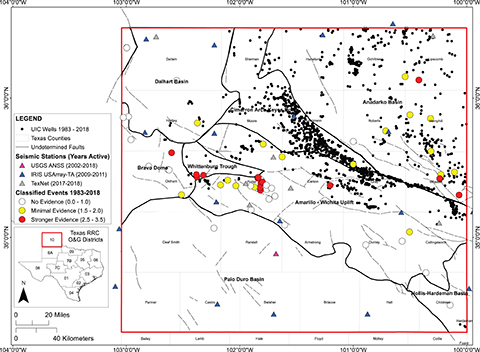
Figure 9.
Map of earthquakes (colored circles) and their respective classification following the methods of Frohlich et al. (2016a, b). Black dots represent all underground injection control (UIC) wells present in study area and dashed lines depict basement-rooted faults with undetermined geometry taken from Ewing (1990). Active seismometer stations including their active years depicted as colored triangles. ANSS = Advanced National Seismic System; IRIS = Incorporated Research Institutions for Seismology; O&G = oil and gas; RRC = Railroad Commission of Texas; TA = USArray transportable array; USGS = US Geological Survey.
Figure 9. Map of earthquakes (colored circles) and their respective classification following the methods of Frohlich et al. (2016a, b). Black dots represent all underground injection control (UIC) wells present in study area and dashed lines depict basement-rooted faults with undetermined geometry taken from Ewing (1990). Active seismometer stations including their active years depicted as colored triangles. ANSS = Advanced National Seismic System; IRIS = Incorporated Research Institutions for Seismology; O&G = oil and gas; RRC = Railroad Commission of Texas; TA = USArray transportable array; USGS = US Geological Survey.