The AAPG/Datapages Combined Publications Database
AAPG Bulletin
Figure
AAPG Bulletin; Year: 2022; Issue: December DOI: 10.1306/08182220071
Return to Full Text
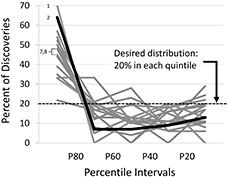
Figure 2.
A percentile histogram plot, where the y axis plots the percentage of discoveries that fell within each predrill estimated ultimate recoverable resource (EUR) quintile bucket. The EUR represents the volume of hydrocarbons, at standard conditions, that ultimately will be recovered from a reservoir before abandonment. The far left (smallest) quintile bucket is bound on the high side by the 80th percentile (P80) so that there is an 80% chance that the outcome will be that amount, or higher; the far right (largest) quintile is bound on the low side by the 20th percentile [P20], so that there is a 20% chance that the outcome will be that amount, or higher. Note the pervasive optimistic bias, with a far greater percentage of discovered field sizes falling below the P80, compared to the outcomes of an unbiased system in which 20% of the results would fall in each quintile. The bold black line represents the data from Figure 1. Source: Rose & Associates’ fourteen studies of published papers and unpublished consultations covering data from the mid-1980s to 2015 across a wide range of basins worldwide. Published papers are annotated by number at the far left of each track: 1 = Moeller (2015); 2 = Søiland (2019) data are bold and recast from Figure 1; 7 = Alexander and Lohr (1998); 8 = Otis and Schneidermann (1997).
Figure 2.
A percentile histogram plot, where the